Welcome to the 2017 digital marketing industry pricing survey. The goal of these survey results is twofold:
Pricing and budgeting are two of the hardest parts of the consulting world, on both sides of the market. Most businesses looking to hire someone have no idea what a reasonable or unreasonable budget is. Most consultants/agencies have very little insight into how much their friends/competitors are charging or making.
After you finish working through these survey results, you’ll be a few steps closer to clarity on those two challenges.
A few notes before we get started:
Let’s get started.
The survey was conducted in December 2016 and had 184 respondents across 19 countries. The country participation breaks down thus:
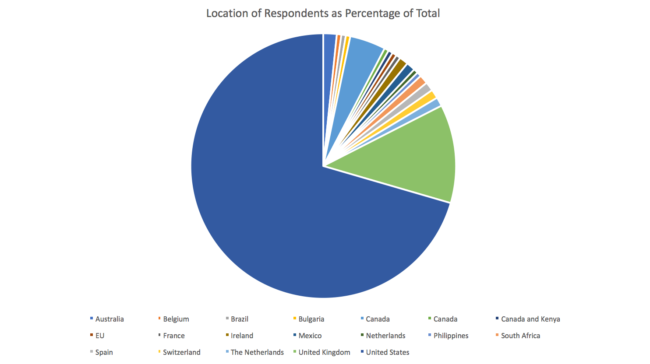
For you data nerds, here is the respondent country breakdown:
| Country | Count | % of Total |
| Australia | 3 | 1.64% |
| Belgium | 1 | 0.55% |
| Brazil | 1 | 0.55% |
| Bulgaria | 1 | 0.55% |
| Canada | 8 | 4.37% |
| Canada | 1 | 0.55% |
| Canada and Kenya | 1 | 0.55% |
| EU | 1 | 0.55% |
| France | 1 | 0.55% |
| Ireland | 2 | 1.09% |
| Mexico | 2 | 1.09% |
| Netherlands | 1 | 0.55% |
| Philippines | 1 | 0.55% |
| South Africa | 2 | 1.09% |
| Spain | 2 | 1.09% |
| Switzerland | 2 | 1.09% |
| The Netherlands | 2 | 1.09% |
| United Kingdom | 22 | 12.02% |
| United States | 129 | 70.49% |
As you can see, there are many countries where we only had one respondent. Thus, there are many graphs that have a “worldwide” rollup that includes these but we have not done country-specific analysis for countries other than the US or UK.
This is not because there are not plenty of fantastic agencies and consultants in those countries, but rather because there were not enough respondents from them to draw good data-driven conclusions.
Throughout this study, I will seek to pull out insights that help both sides of the problem. These will be called out with an INSIGHT: annotation.
First, a high level look at worldwide pricing. As with any averages these numbers need to be further drilled into and dissected, which is done throughout the rest of the study.
To start off, a high level look at how marketing professionals price themselves. This data is worldwide and based off the size of their practice (solo, 2-5 employees, 6-10 employees, 11-20 employees, and 20+ employees):
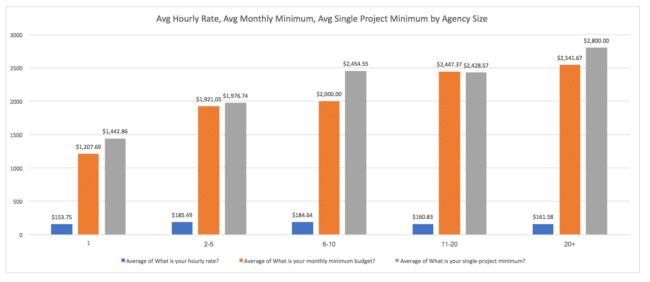
The raw data:
| Size | Average of What is your hourly rate? | Average of What is your monthly minimum budget? | Average of What is your single-project minimum? |
| 1 | $153.75 | $1,207.69 | $1,442.86 |
| 2-5 | $185.49 | $1,921.05 | $1,976.74 |
| 6-10 | $184.64 | $2,000.00 | $2,454.55 |
| 11-20 | $160.83 | $2,447.37 | $2,428.57 |
| 20+ | $161.58 | $2,541.67 | $2,800.00 |
Insight: both Monthly Minimum and Single Project Minimum grow linearly as the company grows. Quite simply, the higher your budget the more likely you are to be able to afford a larger agency that offers more types of services. The lower your budget, the more likely you are to work with an individual consultant or smaller agency, but there’s a caveat here:
Insight: hourly rate does not work linearly like monthly and project minimums as the size goes up. In fact, hourly rate peaks at agencies with 2-5 people, stays steady as the agency grows to 5-10, and then drops a bit as the agency gets over 10 people. What this means, of course, is that when you hire a smaller agency you’ll get fewer hours for your budget. However, this is not necessarily a bad thing because agencies of 2-10 people are often full of rockstar specialists, without the additional more junior employees that you find at larger agencies.
“When you hire a smaller agency you’ll get fewer hours for your budget. However, this is not necessarily a bad thing.”
Now on to pricing by country.
Digital marketing agencies are located all over the world. As you saw at the beginning, this study had respondents from 19 individual countries.
The challenge is that the majority came from the US and UK, and those are the only two that had respondents from every bucket of agency size. Thus, we are only able to compare those two.
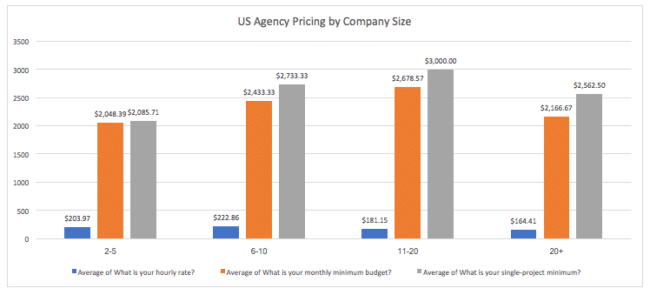
US agencies follow a similar trend to worldwide (which isn’t too surprising as they were 70% of respondents overall). However, it is interesting to note that at least for the respondent pool for this survey the project and monthly minimums are actually less for agencies of 20+ people than for smaller agencies!
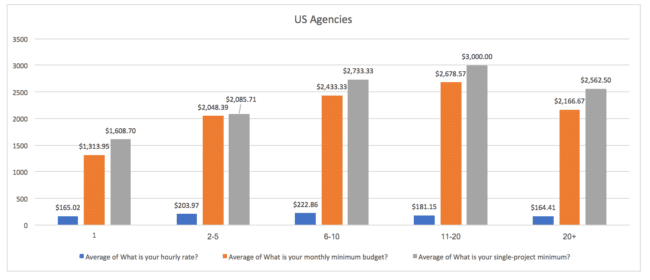
The raw data:
| Company Size | Average of What is your hourly rate? | Average of What is your monthly minimum budget? | Average of What is your single-project minimum? |
| 1 | $165.02 | $1,313.95 | $1,608.70 |
| 2-5 | $203.97 | $2,048.39 | $2,085.71 |
| 6-10 | $222.86 | $2,433.33 | $2,733.33 |
| 11-20 | $181.15 | $2,678.57 | $3,000.00 |
| 20+ | $164.41 | $2,166.67 | $2,562.50 |
Insight: the larger your budget, the larger the agency you can hire. However, the largest agencies take similar size projects to the 6-10 person agencies. Depending on the specific agencies, you may be able to get more marketing channels for the same spend. I was surprised to see that when competing on budgets alone, a lot of businesses may be choosing between the 6-10 person agencies and the 20+ person agencies.
I was surprised to see that when competing on budgets alone, a lot of businesses may be choosing between the 6-10 person agencies and the 20+ person agencies.
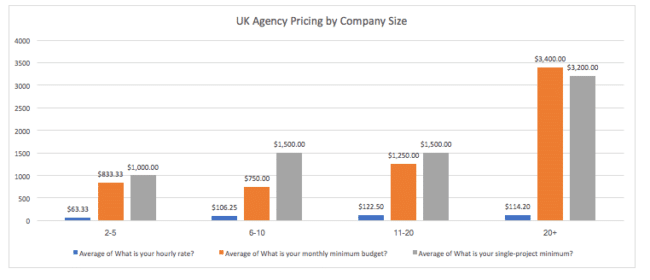
Now on the UK. One of the major trends I have noticed as I’ve worked with US and UK agencies over the last 16 months is that UK agencies charge way less than their US counterparts. I had one agency coaching client who told and showed me all the (amazing) work they were doing for £750 per month. I immediately told him he needed to either raise his rates (true) or cut back on what they were getting for that (also true). A few months later we reconnected and he had done both of those, and lo and behold he had both time and financial margin in his life and was ready to grow his agency again. He was no longer too hungry to eat.
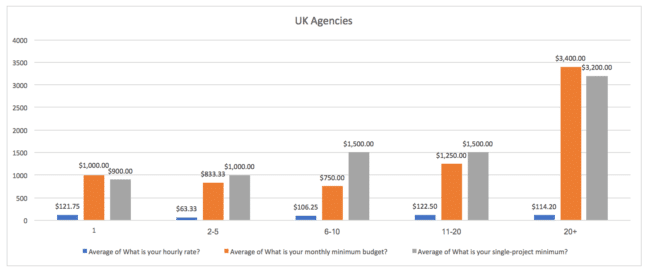
The raw data:
| Company Size | Average of What is your hourly rate? | Average of What is your monthly minimum budget? | Average of What is your single-project minimum? |
| 1 | $121.75 | $1,000.00 | $900.00 |
| 2-5 | $63.33 | $833.33 | $1,000.00 |
| 6-10 | $106.25 | $750.00 | $1,500.00 |
| 11-20 | $122.50 | $1,250.00 | $1,500.00 |
| 20+ | $114.20 | $3,400.00 | $3,200.00 |
Insight: How much more expensive are US agencies than UK agencies?
| Agency Size | Hourly | Monthly | Single Project |
| 1 | 35.54% | 31.40% | 78.74% |
| 2-5 | 222.06% | 145.81% | 108.57% |
| 6-10 | 109.75% | 224.44% | 82.22% |
| 11-20 | 47.88% | 114.29% | 100.00% |
| 20+ | 43.97% | -36.27% | -19.92% |
Insight: Independent UK consultants are twice as expensive as 2-5 person UK agencies, on average. If you’re super price conscious but want just as high of quality of work and are ok with multiple people touching your work, consider a small agency if you are in the UK.
If you are in the UK and super price conscious, consider a small agency because they may offer the same level of service at the half the price of a solo consultant.
Something that many businesses do not understand as they set out to hire a marketer or agency is that there are different types of agencies and consultants. I’m not talking just “agencies who do SEO and don’t” but deeper than that to the level of “agencies who do SEO strategy vs agencies who do SEO services and implementation vs agencies who do both”.
This is something I try to get to the bottom of with all businesses I speak with through the Credo Porter service, and also wrote about here – Should I Hire A Consultant or Agency? – so while that insight is outside of the scope of this study, this section should help you frame your expectations for how much you will pay depending on if you hire an agency or a consultant.
Please note: budget is only one part of selecting a marketing partner to work with. What’s more important is that you hire the right person, and making a decision strictly based off of budget or “the number of hours you will get per month” will not make you successful. Please read the post I linked to above, and if you want to chat about your project with me then schedule a call through the Porter service.
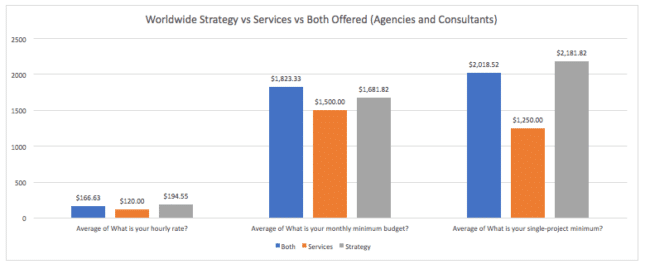
Here is the pricing worldwide divided up by Both, Strategy Only, and Services Only:
And the raw data:
| Types of Services Offered (Agencies and Consultants Worldwide) | Average of What is your hourly rate? | Average of What is your monthly minimum budget? | Average of What is your single-project minimum? |
| Both | $166.63 | $1,823.33 | $2,018.52 |
| Services | $120.00 | $1,500.00 | $1,250.00 |
| Strategy | $194.55 | $1,681.82 | $2,181.82 |
Insight: Agencies who do both services and strategy have a higher monthly minimum than agencies who do only services or only strategy. The single project minimum is highest for agencies who do only strategy.
I should note that while there are agencies all over the world offering different types, I only had enough responses worldwide and from the US to do this analysis. I do include the UK data that I have, but that data is only for UK agencies who do both services and strategy.
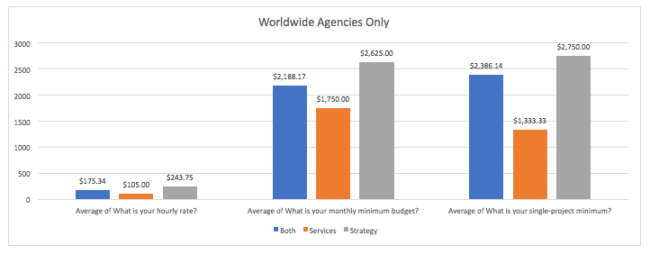
Here is the pricing by hour/monthly/single projects worldwide, categorized by types of work offered.
And the raw data:
| Types of Services Offered (Agencies Worldwide) | Average of What is your hourly rate? | Average of What is your monthly minimum budget? | Average of What is your single-project minimum? |
| Both | $175.34 | $2,188.17 | $2,386.14 |
| Services | $105.00 | $1,750.00 | $1,333.33 |
| Strategy | $243.75 | $2,625.00 | $2,750.00 |
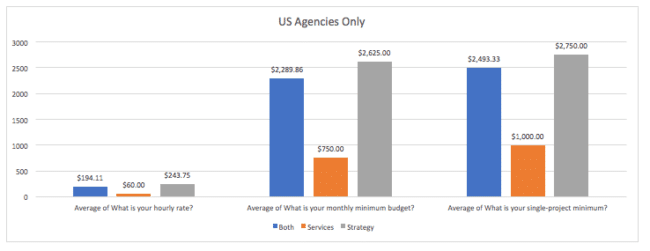
US agencies were the vast majority of respondents to the survey, thus we had the best data for this country.
And the raw data:
| Types of Services Offered (Agencies Only) | Average of What is your hourly rate? | Average of What is your monthly minimum budget? | Average of What is your single-project minimum? |
| Both | $194.11 | $2,289.86 | $2,493.33 |
| Services | $60.00 | $750.00 | $1,000.00 |
| Strategy | $243.75 | $2,625.00 | $2,750.00 |
Compared with worldwide, US agency pricing differs thus:
| Types of Services Offered (US Agencies) | Diff Hourly | Diff Monthly | Diff Single Project |
| Both | +10.70% | +4.65% | +4.49% |
| Services | -42.86% | -57.14% | -25.00% |
| Strategy | 0.00% | 0.00% | 0.00% |
Insight: US agencies are more expensive than the worldwide average, and agencies who provide only strategy are the most expensive. In this study, US and worldwide averages are very close because of the limited dataset.
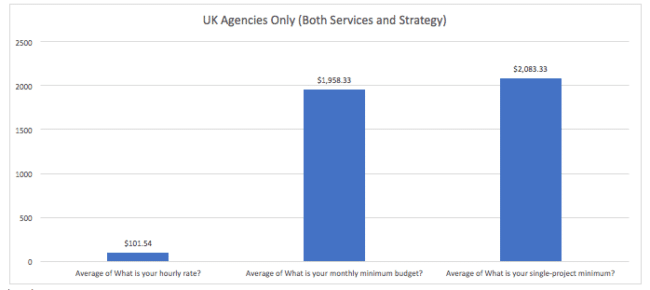
As stated above, the data became quite thin for any individual country other than the United States. Here is the UK agency-only pricing, and note that this is only for agencies who do both services and strategy.
The raw data:
| Types of Services Offered | Average of What is your hourly rate? | Average of What is your monthly minimum budget? | Average of What is your single-project minimum? |
| Both | $101.54 | $1,958.33 | $2,083.33 |
Insight: UK agencies charge less per hour, per project, and monthly than both worldwide and US-only agencies. UK agencies need to raise their rates!
Consultants price themselves differently from agencies, as you will see on the next page. It is important to note that if you are looking to hire a solo marketer, you will often pay more per hour and even higher for strategy than services. At the same time, most consultants offer some set of services but if you need an outside vendor to run all of your marketing you will likely be better off with an agency.
Worldwide, consultants charge less hourly when they do both as well as just strategy, but charge more than agencies when they do services.
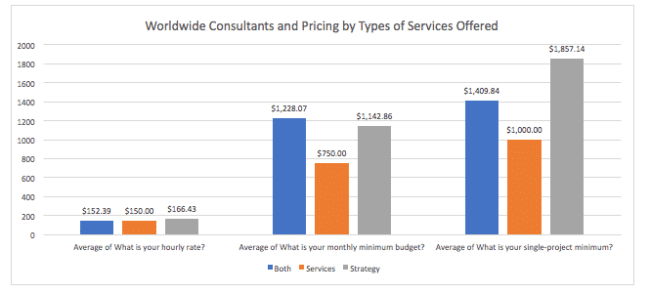
The raw data:
| Types of Work Offered (Consultants Only) | Average of What is your hourly rate? | Average of What is your monthly minimum budget? | Average of What is your single-project minimum? |
| Both | $152.39 | $1,228.07 | $1,409.84 |
| Services | $150.00 | $750.00 | $1,000.00 |
| Strategy | $166.43 | $1,142.86 | $1,857.14 |
Insight: consultants reading this should raise their rates when they’re doing strategy only, especially as a specialist.
From our data, US consultants charge more per hour than the worldwide average. Their services monthly minimum is less than the worldwide average, but the monthly for both as well as just strategy is higher than the worldwide average.
img class=”wp-image-15895 size-large” src=”https://getcredo.com/wp-content/uploads/2017/02/Screenshot-2017-02-13-13.30.45-650×273.png” alt=”screenshot-2017-02-13-13-30-45″ width=”640″ height=”269″ /> Click to EnlargeThe raw data:
| Types of Work Offered | Average of What is your hourly rate? | Average of What is your monthly minimum budget? | Average of What is your single-project minimum? |
| Both | $162.85 | $1,315.79 | $1,550.00 |
| Services | $150.00 | $500.00 | $1,000.00 |
| Strategy | $185.00 | $1,400.00 | $2,200.00 |
Insight: US consultants on average are more expensive than UK consultants, but with a lower monthly minimum for services. Their single project minimum is sizably larger than the worldwide average.
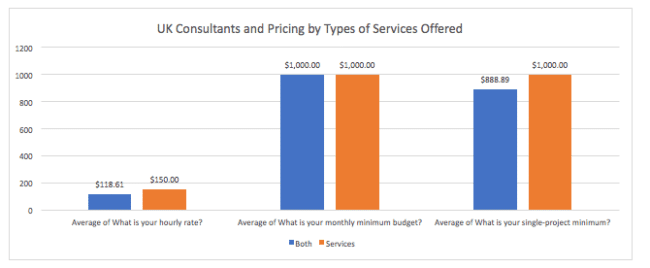
Similar to the UK agencies data, we did not have a complete set of results for the UK. However, there were enough to present some data for you to go off of for UK consultant pricing by service type:
One unfortunate reality in the consulting world is that a lot of clients have been burned by someone bad in the past. This was either someone who actually scammed them (which happens all too often) or just an ineffective agency. When this happens, the client often wants an individual consultant even if they need multiple services offered.
Let’s dig into solo consultant pricing as well as services that individual consultants offer.
According to Fast Company, “As of May 2015, 15.5 million people in the U.S. were self-employed” and that number is expected to rise to 40% of the total workforce by 2020. That 15.5 million number was up by 1 million from just the year previous, so the growth is rapid.
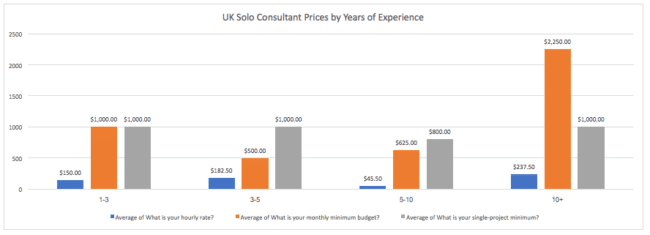
Here are the rates of solo consultants by years of experience.
[caption id="attachment_15799" align="aligncenter" width="640"]“>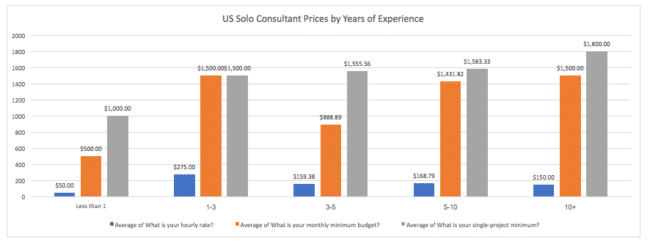 Click to Enlarge
Raw data by years of experience:
| Years Doing Marketing (US) | Average of What is your hourly rate? | Average of What is your monthly minimum budget? | Average of What is your single-project minimum? |
| Less than 1 | $50.00 | $500.00 | $1,000.00 |
| 1-3 | $275.00 | $1,500.00 | $1,500.00 |
| 3-5 | $159.38 | $888.89 | $1,555.56 |
| 5-10 | $168.79 | $1,431.82 | $1,583.33 |
| 10+ | $150.00 | $1,500.00 | $1,800.00 |
Insight: not surprisingly, the minimum projects taken on by solo consultants increases by experience as they realize that fewer clients that they charge bigger retainers to often means higher happiness.
It is interesting that the highest hourly rate is for individual consultants with only 1-3 years of experience. I expected the 10+ years of experience to have the highest hourly rate by far. My only theory as to why this is the case is that solo consultants early on in their freelance career charge more because they are not sure they can sustain themselves freelance.
Insight: If you are a business with a lower monthly budget, understand that you may need to make a tradeoff between hours worked for you and total budget.
Here’s how US solo consultants price themselves based off the number of services they offer:
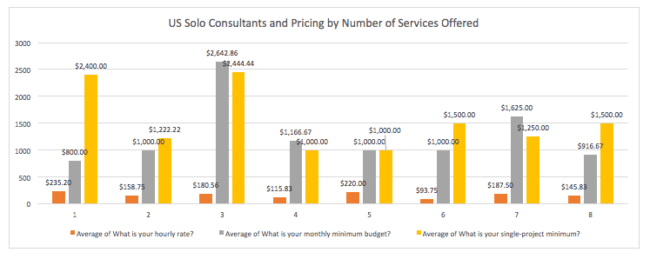
The raw data:
| Number of Services Offered (US Consultants) | Average of What is your hourly rate? | Average of What is your monthly minimum budget? | Average of What is your single-project minimum? |
| 1 | $235.20 | $800.00 | $2,400.00 |
| 2 | $158.75 | $1,000.00 | $1,222.22 |
| 3 | $180.56 | $2,642.86 | $2,444.44 |
| 4 | $115.83 | $1,166.67 | $1,000.00 |
| 5 | $220.00 | $1,000.00 | $1,000.00 |
| 6 | $93.75 | $1,000.00 | $1,500.00 |
| 7 | $187.50 | $1,625.00 | $1,250.00 |
| 8 | $145.83 | $916.67 | $1,500.00 |
Insight: Need more services? You’re likely to pay less per hour and have a lower required monthly minimum or single project fee. The fewer and more specialized services you need, the more you will pay.
In the UK, the trend continues. According to a source, “Currently in the United Kingdom, more than 31 percent of management consultants and business analysts are self-employed.”
Insight: solo UK consultants charge more per hour, on average, based on their years of experience (overlooking the 5-10 years of experience range because this is a small sample size). Overall, minimum project sizes are smaller than in the US.
The raw data by years of experience:
| Years Doing Marketing (UK) | Average of What is your hourly rate? | Average of What is your monthly minimum budget? | Average of What is your single-project minimum? |
| 1-3 | $150.00 | $1,000.00 | $1,000.00 |
| 3-5 | $182.50 | $500.00 | $1,000.00 |
| 5-10 | $45.50 | $625.00 | $800.00 |
| 10+ | $237.50 | $2,250.00 | $1,000.00 |
Here’s how UK solo consultants price themselves based off the number of services they offer:
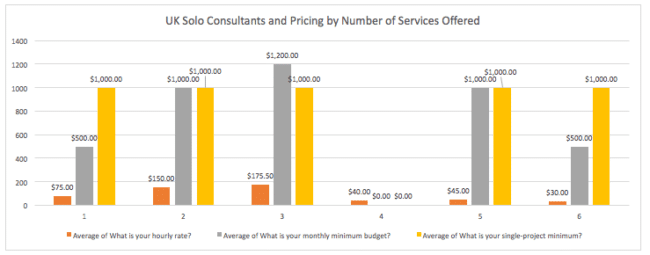
The raw data:
| Types of Services Offered | Average of What is your hourly rate? | Average of What is your monthly minimum budget? | Average of What is your single-project minimum? |
| Both | $118.61 | $1,000.00 | $888.89 |
| Services | $150.00 | $1,000.00 | $1,000.00 |
Insight: similar to the US, the more services you need the less you will pay per hour. The more specialized your needs (and therefore fewer numbers of services), the more you will pay. Hiring a specialist is almost always more expensive than hiring a generalist.
Pricing for non US/UK consultants by number of services offered is, quite simply, all over the map.
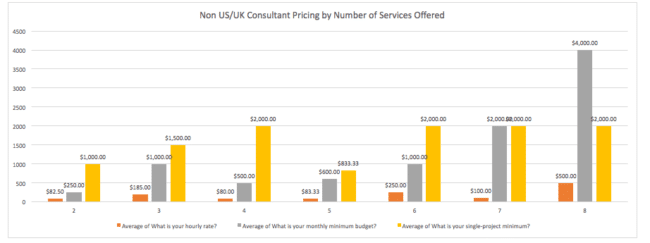
The raw data:
| Number of Services Offered | Average of What is your hourly rate? | Average of What is your monthly minimum budget? | Average of What is your single-project minimum? |
| 2 | $82.50 | $250.00 | $1,000.00 |
| 3 | $185.00 | $1,000.00 | $1,500.00 |
| 4 | $80.00 | $500.00 | $2,000.00 |
| 5 | $83.33 | $600.00 | $833.33 |
| 6 | $250.00 | $1,000.00 | $2,000.00 |
| 7 | $100.00 | $2,000.00 | $2,000.00 |
| 8 | $500.00 | $4,000.00 | $2,000.00 |
Insight: Except for at the top end of the number of services offered, non US/UK consultants charge less per hour, per project, and monthly. Of course, the tradeoff is that communication will be more difficult because of timezones and the consultant may not have firsthand knowledge or experience with your country’s competitive landscape. If you need just services and are very budget conscious, you should consider a consultant not based in the US or UK. But since most consultants do either both or just strategy, it is usually best to hire someone in your own country.
If you need just services and are very budget conscious, you should consider a consultant not based in the US or UK. But since most consultants do either both or just strategy, it is usually best to hire someone in your own country.
Now on to the agency insights. Let’s look at them independent of individual solo consultants to get a fuller picture of how they price according to types of services they offer, since we already covered overall pricing by size on page 2 of this study.
Here is hourly/monthly/single project pricing for agencies by company size:
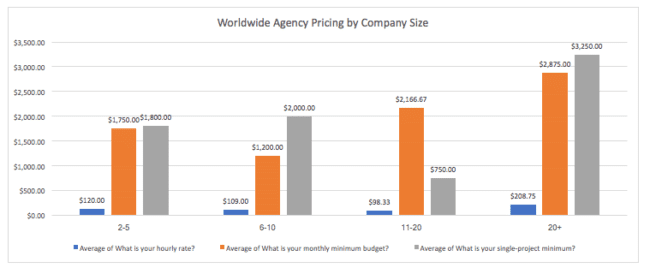
And the raw data:
| Number of Employees (Worldwide Agencies) | Average of What is your hourly rate? | Average of What is your monthly minimum budget? | Average of What is your single-project minimum? |
| 2-5 | $120.00 | $1,750.00 | $1,800.00 |
| 6-10 | $109.00 | $1,200.00 | $2,000.00 |
| 11-20 | $98.33 | $2,166.67 | $750.00 |
| 20+ | $208.75 | $2,875.00 | $3,250.00 |
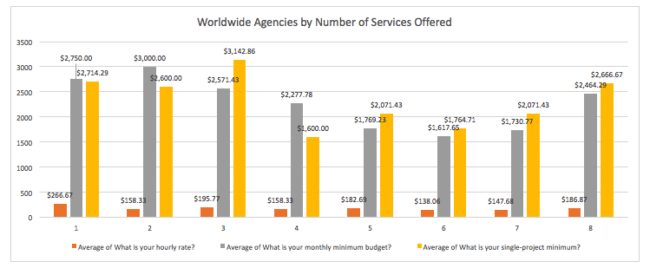
And the raw data:
| Number of Services Offered | Average of What is your hourly rate? | Average of What is your monthly minimum budget? | Average of What is your single-project minimum? |
| 1 | $266.67 | $2,750.00 | $2,714.29 |
| 2 | $158.33 | $3,000.00 | $2,600.00 |
| 3 | $195.77 | $2,571.43 | $3,142.86 |
| 4 | $158.33 | $2,277.78 | $1,600.00 |
| 5 | $182.69 | $1,769.23 | $2,071.43 |
| 6 | $138.06 | $1,617.65 | $1,764.71 |
| 7 | $147.68 | $1,730.77 | $2,071.43 |
| 8 | $186.87 | $2,464.29 | $2,666.67 |
And the raw data:
| Number of Employees (US Agencies) | Average of What is your hourly rate? | Average of What is your monthly minimum budget? | Average of What is your single-project minimum? |
| 2-5 | $203.97 | $2,048.39 | $2,085.71 |
| 6-10 | $222.86 | $2,433.33 | $2,733.33 |
| 11-20 | $181.15 | $2,678.57 | $3,000.00 |
| 20+ | $164.41 | $2,166.67 | $2,562.50 |
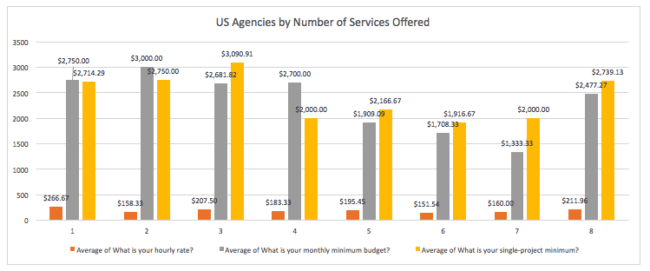
And the raw data:
| Number of Services Offered | Average of What is your hourly rate? | Average of What is your monthly minimum budget? | Average of What is your single-project minimum? |
| 1 | $266.67 | $2,750.00 | $2,714.29 |
| 2 | $158.33 | $3,000.00 | $2,750.00 |
| 3 | $207.50 | $2,681.82 | $3,090.91 |
| 4 | $183.33 | $2,700.00 | $2,000.00 |
| 5 | $195.45 | $1,909.09 | $2,166.67 |
| 6 | $151.54 | $1,708.33 | $1,916.67 |
| 7 | $160.00 | $1,333.33 | $2,000.00 |
| 8 | $211.96 | $2,477.27 | $2,739.13 |
The raw data:
| Number of Employees (UK Agencies) | Average of What is your hourly rate? | Average of What is your monthly minimum budget? | Average of What is your single-project minimum? |
| 2-5 | $63.33 | $833.33 | $1,000.00 |
| 6-10 | $106.25 | $750.00 | $1,500.00 |
| 11-20 | $122.50 | $1,250.00 | $1,500.00 |
| 20+ | $114.20 | $3,400.00 | $3,200.00 |
And the raw data:
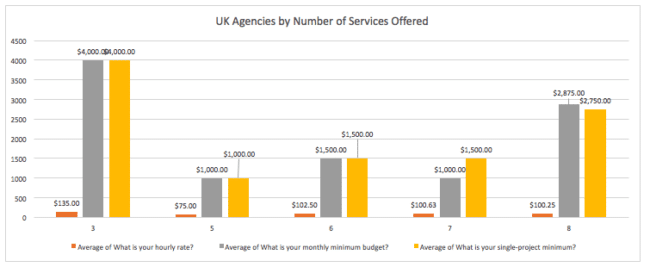
| Number of Services Offered | Average of What is your hourly rate? | Average of What is your monthly minimum budget? | Average of What is your single-project minimum? |
| 3 | $135.00 | $4,000.00 | $4,000.00 |
| 5 | $75.00 | $1,000.00 | $1,000.00 |
| 6 | $102.50 | $1,500.00 | $1,500.00 |
| 7 | $100.63 | $1,000.00 | $1,500.00 |
| 8 | $100.25 | $2,875.00 | $2,750.00 |
Overall, these insights held true to what we have seen before:
I have two main insights for this section.
US as compared to world:
| Number of Employees | Average of What is your hourly rate? | Average of What is your monthly minimum budget? | Average of What is your single-project minimum? |
| 2-5 | 69.98% | 17.05% | 15.87% |
| 6-10 | 104.46% | 102.78% | 36.67% |
| 11-20 | 84.22% | 23.63% | 300.00% |
| 20+ | -21.24% | -24.64% | -21.15% |
Insight: The US is almost always more expensive than the rest of the world, except for this study at the biggest agencies.
UK as compared to world:
| Number of Employees | Average of What is your hourly rate? | Average of What is your monthly minimum budget? | Average of What is your single-project minimum? |
| 2-5 | -47.22% | -52.38% | -44.44% |
| 6-10 | -2.52% | -37.50% | -25.00% |
| 11-20 | 24.58% | -42.31% | 100.00% |
| 20+ | -45.29% | 18.26% | -1.54% |
Insight: In contrast to the US, the UK is almost always less expensive than the rest of the world at large.
Probably many of you are here because you are either an SEO agency or looking to hire an SEO. While I did a study on a much smaller subset of agencies at the end of 2015, this is the more complete version.
Please note that these are prices for agencies and consultants who offer SEO, though not necessarily exclusively. Of 184 respondents to this survey, only four (4) did SEO exclusively!
Worldwide, SEOs charge $167.59 per hour on average and the minimum single project is just over two thousand dollars at $2,056.60.
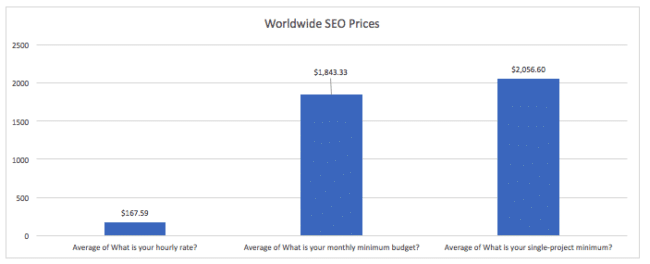
And the raw data:
| Average of What is your hourly rate? | Average of What is your monthly minimum budget? | Average of What is your single-project minimum? |
| $167.59 | $1,843.33 | $2,056.60 |
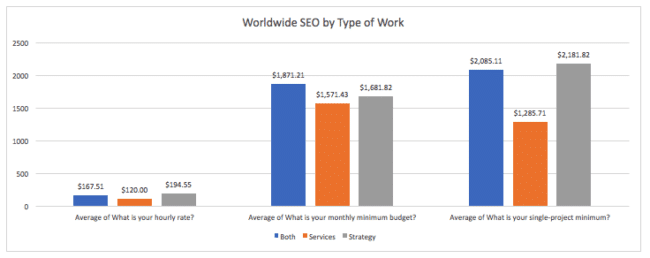
And the raw data:
| Type of Work | Average of What is your hourly rate? | Average of What is your monthly minimum budget? | Average of What is your single-project minimum? |
| Both | $167.51 | $1,871.21 | $2,085.11 |
| Services | $120.00 | $1,571.43 | $1,285.71 |
| Strategy | $194.55 | $1,681.82 | $2,181.82 |
So how do agencies and consultants who offer SEO price themselves worldwide?
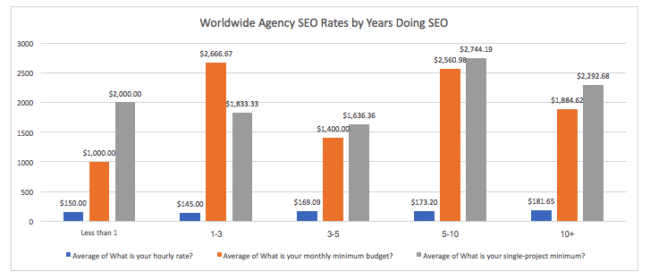
The raw data:
| Years Doing SEO | Average of What is your hourly rate? | Average of What is your monthly minimum budget? | Average of What is your single-project minimum? |
| Less than 1 | $150.00 | $1,000.00 | $2,000.00 |
| 1-3 | $145.00 | $2,666.67 | $1,833.33 |
| 3-5 | $169.09 | $1,400.00 | $1,636.36 |
| 5-10 | $173.20 | $2,560.98 | $2,744.19 |
| 10+ | $181.65 | $1,884.62 | $2,292.68 |
Insight: there’s no rhyme or reason to this data and why agencies with more years of experience charge less per project than smaller or bigger agencies. All this really tells me is that most agencies are not being exact on their pricing at all and pricing for agencies right now is arbitrary.
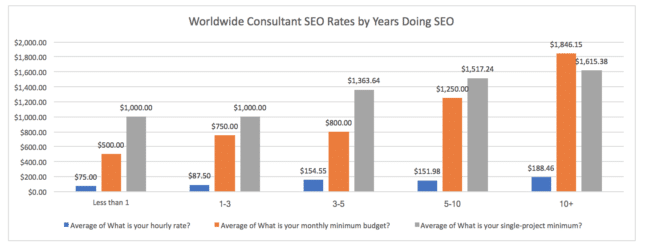
The raw data:
| Years Doing SEO | Average of What is your hourly rate? | Average of What is your monthly minimum budget? | Average of What is your single-project minimum? |
| Less than 1 | $75.00 | $500.00 | $1,000.00 |
| 1-3 | $87.50 | $750.00 | $1,000.00 |
| 3-5 | $154.55 | $800.00 | $1,363.64 |
| 5-10 | $151.98 | $1,250.00 | $1,517.24 |
| 10+ | $188.46 | $1,846.15 | $1,615.38 |
Insight: Now this data looks a bit more familiar. As solo consultants have more experience, their hourly rates and minimum projects go up. Makes total sense!
Now let’s move on to the United States and SEO pricing.
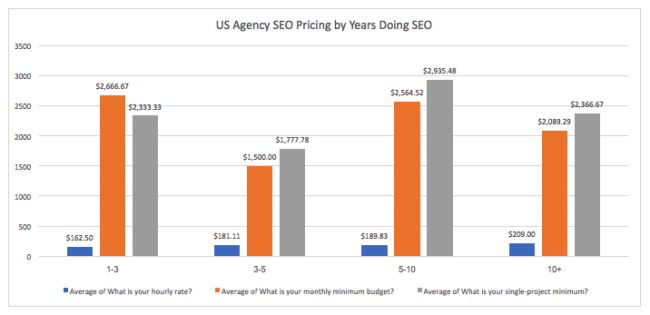
And the raw data:
| Years Doing SEO | Average of What is your hourly rate? | Average of What is your monthly minimum budget? | Average of What is your single-project minimum? |
| 1-3 | $162.50 | $2,666.67 | $2,333.33 |
| 3-5 | $181.11 | $1,500.00 | $1,777.78 |
| 5-10 | $189.83 | $2,564.52 | $2,935.48 |
| 10+ | $209.00 | $2,089.29 | $2,366.67 |
And for US consultants:
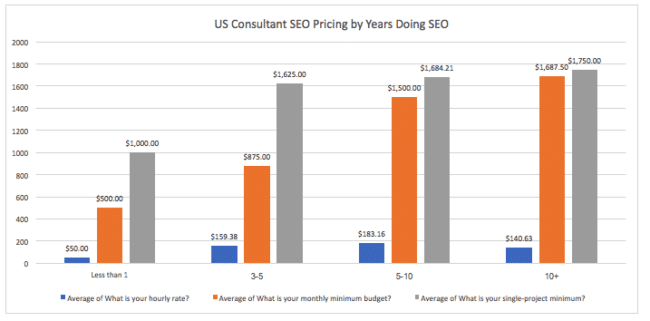
And the raw data:
| Years Doing SEO | Average of What is your hourly rate? | Average of What is your monthly minimum budget? | Average of What is your single-project minimum? |
| Less than 1 | $50.00 | $500.00 | $1,000.00 |
| 3-5 | $159.38 | $875.00 | $1,625.00 |
| 5-10 | $183.16 | $1,500.00 | $1,684.21 |
| 10+ | $140.63 | $1,687.50 | $1,750.00 |
Insight: Not too surprisingly, US agencies tend to have higher monthly retainers and minimum project fees than individual consultants. Hourly rates are fairly similar across agencies and consultants in the US.
Insight: We should note that the consultant pricing follows the curve we have seen before, where hourly rates are highest in the middle and lower on the ends. This does not hold true for agencies, presumably because the older the agency is the more business savvy they become.
Let’s also have a look at UK SEO agency and consultant pricing.
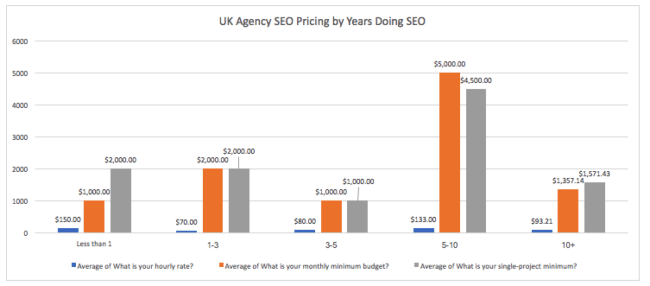
And the raw data:
| Years Doing SEO | Average of What is your hourly rate? | Average of What is your monthly minimum budget? | Average of What is your single-project minimum? |
| Less than 1 | $150.00 | $1,000.00 | $2,000.00 |
| 1-3 | $70.00 | $2,000.00 | $2,000.00 |
| 3-5 | $80.00 | $1,000.00 | $1,000.00 |
| 5-10 | $133.00 | $5,000.00 | $4,500.00 |
| 10+ | $93.21 | $1,357.14 | $1,571.43 |
Insight: Interestingly, UK agencies tend to charge the most when they are brand new, and the hourly rate mostly goes down from there except in the 5-10 years of experience range. Except for the outliers in the 3-5 range for monthly/project work, minimums stay relatively constant across the years.
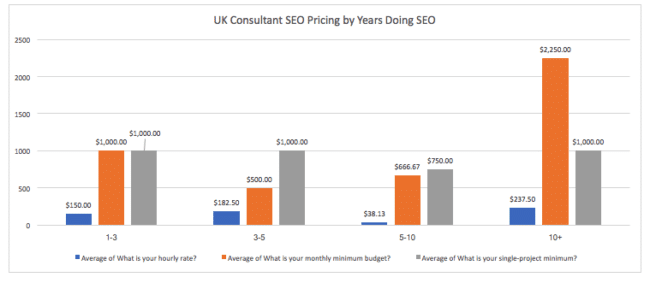
And the raw data:
| Years Doing SEO | Average of What is your hourly rate? | Average of What is your monthly minimum budget? | Average of What is your single-project minimum? |
| 1-3 | $150.00 | $1,000.00 | $1,000.00 |
| 3-5 | $182.50 | $500.00 | $1,000.00 |
| 5-10 | $38.13 | $666.67 | $750.00 |
| 10+ | $237.50 | $2,250.00 | $1,000.00 |
Insight: Now this is heartening to see. UK consultants seem to price themselves better across the years for hourly rates, but don’t really raise their minimums for projects or monthly. After seeing this across the UK for this whole study, one must wonder if this is because there are many more small businesses in the UK and thus agencies to serve them.
There could be an existing gap in the market for a large agency that serves small businesses with smaller budgets at scale.
Finally, I’d like to note the raw numbers of respondents in each pricing category. This information is important so that you can see how businesses spread across the different buckets of pricing. While the average of a single project may be $2000 for example, it’s important to note that 14.21% of respondents have a single project minimum of at least $5000.
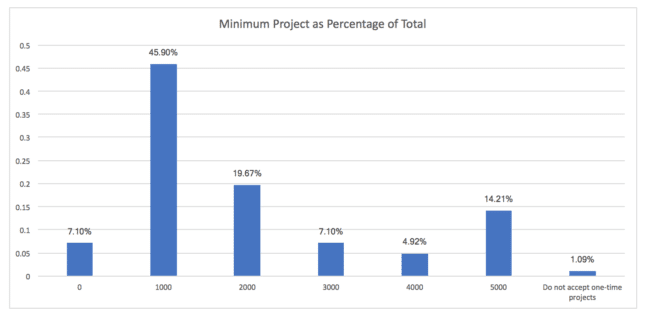
The raw data:
| Minimum Project | Percentage of Total |
| 0 | 7.10% |
| 1000 | 45.90% |
| 2000 | 19.67% |
| 3000 | 7.10% |
| 4000 | 4.92% |
| 5000 | 14.21% |
| Do not accept one-time projects | 1.09% |
Hourly rates range from $25 per hour to $500 per hour, with the majority in the $100-$250 per hour range. However, there are definitely a subset higher than that.
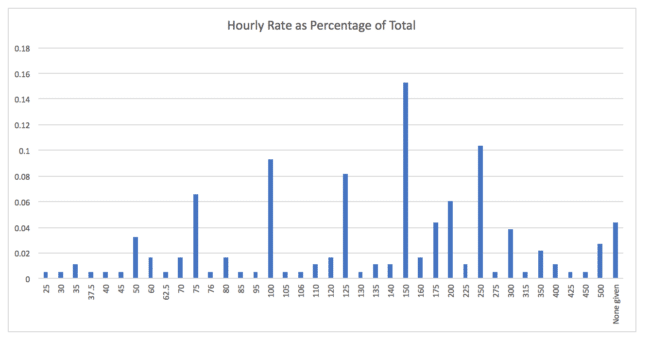
And the raw data:
| Hourly Rate | % of total |
| 25 | 0.55% |
| 30 | 0.55% |
| 35 | 1.09% |
| 37.5 | 0.55% |
| 40 | 0.55% |
| 45 | 0.55% |
| 50 | 3.28% |
| 60 | 1.64% |
| 62.5 | 0.55% |
| 70 | 1.64% |
| 75 | 6.56% |
| 76 | 0.55% |
| 80 | 1.64% |
| 85 | 0.55% |
| 95 | 0.55% |
| 100 | 9.29% |
| 105 | 0.55% |
| 106 | 0.55% |
| 110 | 1.09% |
| 120 | 1.64% |
| 125 | 8.20% |
| 130 | 0.55% |
| 135 | 1.09% |
| 140 | 1.09% |
| 150 | 15.30% |
| 160 | 1.64% |
| 175 | 4.37% |
| 200 | 6.01% |
| 225 | 1.09% |
| 250 | 10.38% |
| 275 | 0.55% |
| 300 | 3.83% |
| 315 | 0.55% |
| 350 | 2.19% |
| 400 | 1.09% |
| 425 | 0.55% |
| 450 | 0.55% |
| 500 | 2.73% |
| None given | 4.37% |
Similar to how the above two work, there are a large number of respondents who work within the $500-$2000/mo range but there are also a significant number that work in the $5000+ a month range.
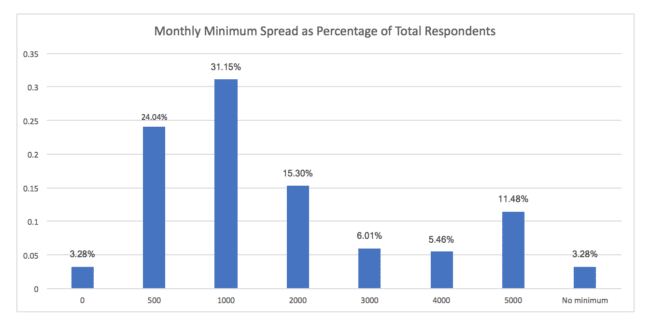
And the raw data:
| Monthly Minimum | % of total |
| 0 | 3.28% |
| 500 | 24.04% |
| 1000 | 31.15% |
| 2000 | 15.30% |
| 3000 | 6.01% |
| 4000 | 5.46% |
| 5000 | 11.48% |
| No minimum | 3.28% |
This survey came out of over a year running GetCredo.com and learning much more about how businesses hire a consultant or agency to grow their business. Over the months, I’ve seen that a lot of businesses have absolutely zero idea what to look for in hiring a consultant or agency.
A year and a half ago I wrote a post about SEO consultant rates which as been quite popular. For that post, I took the 40 or so pros I currently had on Credo and dissected their pricing to get the charts seen there.
The survey results you see on this page are an expansion of that. The digital marketing industry is still way too transparent, and over the last few weeks I’ve seen even more how even agencies within the digital world who do not do SEO don’t trust a lot of other agencies. Agencies are all about trust, and your reputation is on the line.
Those are the problems I’m tackling at Credo. This pricing survey is just the start.
Any comments/questions? Send them to us directly – [email protected] with “Survey Feedback” in your subject line!
This page last updated on July 8, 2020 by John Doherty
Drive results for your marketing needs with the Credo network. Get started today (it's free and there is no obligation)!
 Loading...