Dear reader,
Welcome to Credo’s digital marketing pricing survey results. We released the first version of this survey in 2017 (link here) and updated it for 2019. These survey results comprise answers from 271 marketing agencies and consultants across the United States, United Kingdom, and various other countries.
We asked questions like:
For these results, we have broken them down into chapters according to themes and done our best to dig up the most interesting and unexpected insights while focusing primarily on the most common questions like:
Of course, there are other insights we could have analyzed and pulled out from the data.
To that end, we’ve made the full data available here so that you can analyze it, pull out insights, and even correct us if we did something wrong!
There are a few differences in this survey from 2017, namely:
Enjoy.
John Doherty and the Credo team
The demographics of the firms who responded to the survey are important to cover so that one can understand how pricing differs based on location and size of company.
The 2019 survey had 271 qualified respondents. The synopsis of the findings in this section, and how you should mentally filter the data presented throughout the rest of this study, is:
Of these 271, this is the breakdown by size of company:
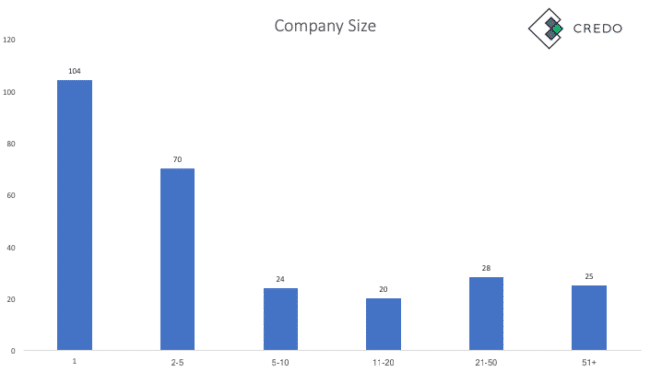
And the raw data:
| Company Size | Count | % of total |
| 1 | 104 | 38.38% |
| 2-5 | 70 | 25.83% |
| 5-10 | 24 | 8.86% |
| 11-20 | 20 | 7.38% |
| 21-50 | 28 | 10.33% |
| 51+ | 25 | 9.23% |
As one can see, 38.38% of total respondents are solo practitioners, which at Credo we call “consultants”.
This means that 61.62% of the respondents are 2+ people, which at Credo we call “agencies”.
Credo is (purposefully) very United States centric, so the location of respondents was also very US-centric. Here is the breakdown visually:
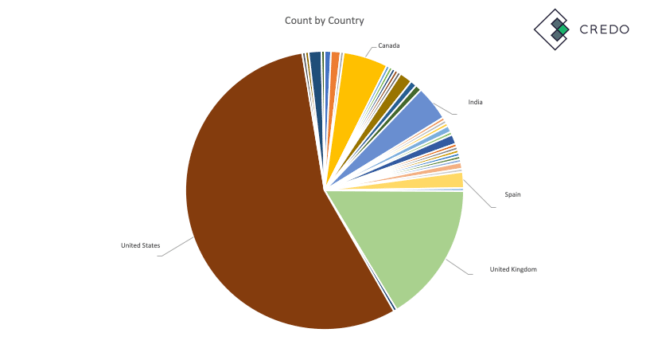
Here is the raw data:
| Country | Count | Percentage of total |
| United States | 151 | 55.72% |
| United Kingdom | 44 | 16.24% |
| Canada | 14 | 5.17% |
| India | 11 | 4.06% |
| Spain | 5 | 1.85% |
| Europe | 4 | 1.48% |
| United States, United Kingdom | 4 | 1.48% |
| Australia | 3 | 1.11% |
| Netherlands | 3 | 1.11% |
| Argentina | 2 | 0.74% |
| France | 2 | 0.74% |
| Germany | 2 | 0.74% |
| Kosovo | 2 | 0.74% |
| Romania | 2 | 0.74% |
| Brazil | 1 | 0.37% |
| Canada, United Kingdom | 1 | 0.37% |
| Denmark | 1 | 0.37% |
| Denmark, Europe | 1 | 0.37% |
| Digital Nomad | 1 | 0.37% |
| EU | 1 | 0.37% |
| Ireland | 1 | 0.37% |
| Israel | 1 | 0.37% |
| Italy | 1 | 0.37% |
| Mexico | 1 | 0.37% |
| New Zealand | 1 | 0.37% |
| Norway | 1 | 0.37% |
| Panama | 1 | 0.37% |
| Peru | 1 | 0.37% |
| Philippines | 1 | 0.37% |
| Portugal | 1 | 0.37% |
| South Africa | 1 | 0.37% |
| Sweden | 1 | 0.37% |
| United Kingdom, Ireland | 1 | 0.37% |
| United States, Canada | 1 | 0.37% |
| United States, Canada, United Kingdom | 1 | 0.37% |
| United States, United Kingdom, Bulgaria | 1 | 0.37% |
As one can see, 55.27% of respondents are US-only based.
When we expand the locations to the top 6 locations, we see that 84.5% of respondents are in just those 6 locations (including the generic “Europe” entry).
Thus, the data in this survey should be viewed as “rates for US and European countries” primarily with a heavy emphasis on the United States.
Another important area to discover is how many years the agencies or consultants who responded have worked in digital marketing. The answers to this question we asked are a bit nebulous as some have told me that they put “the number of years they’ve been in business” while others answered it as “the cumulative numbers of years of experience between everyone at the company”.
That said, these numbers still are important to see and the vast majority answered it as either “number of years in business” when at an agency and “number of years working in digital marketing” as a consultant. Thus, we have divided up the data by both the aggregate data and then also by size of company (agency or consultant).
Here are the years of experience of all respondents, by percentage of the total:
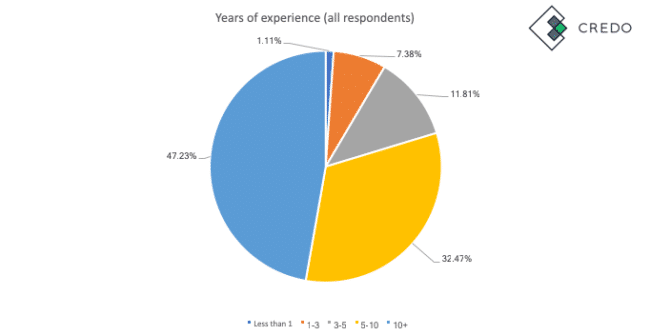
And the raw data:
| All | ||
| Years of experience | Count | % of respondents |
| Less than 1 | 3 | 1.11% |
| 1-3 | 20 | 7.38% |
| 3-5 | 32 | 11.81% |
| 5-10 | 88 | 32.47% |
| 10+ | 128 | 47.23% |
Here are the years of experience for agencies, as a percentage of all agencies who responded:
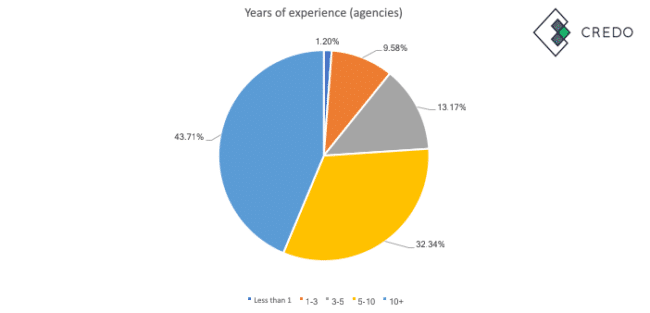
And the raw data:
| Agency | ||
| Number of years (agency) | Count | % of respondents |
| Less than 1 | 2 | 1.20% |
| 1-3 | 16 | 9.58% |
| 3-5 | 22 | 13.17% |
| 5-10 | 54 | 32.34% |
| 10+ | 73 | 43.71% |
Here are the years of experience for the solo consultant respondents, as a percentage of all consultants who responded:
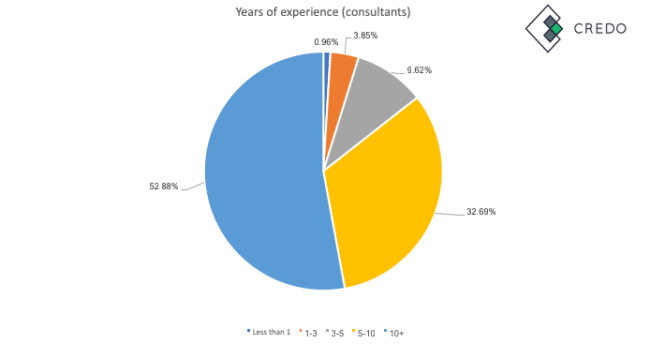
And the raw data:
| Consultant | ||
| Number of years (consultant) | Count | % of respondents |
| Less than 1 | 1 | 0.96% |
| 1-3 | 4 | 3.85% |
| 3-5 | 10 | 9.62% |
| 5-10 | 34 | 32.69% |
| 10+ | 55 | 52.88% |
Credo is very SEO-focused for the clients we bring in who are looking to hire. In fact, over 70% are looking for a project that has an SEO component (technical, content, outreach) involved.
There are many studies out there that show “SEO consultant rates” or “SEO agency rates”, and while those may have more respondents than ours they are also more global-focused and less focused on the specific countries that Credo serves.
So, this section is mostly about US and UK based SEO agencies and consultants, though we also give you a view into our view on the global SEO market and its rates.
Tired of not closing enough consulting clients? Download our free guide to closing more of the prospects you pitch.
Oops! We could not locate your form.
The important takeaways from this section are:
Let’s get into the numbers.
First, let’s look at the SEO firm average rates worldwide.
Worldwide, SEO firms charge on average $149 per hour.
Here is how it breaks down:
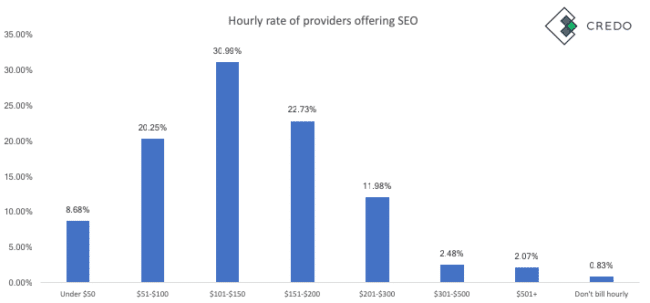
As you can see, on average:
Now let’s look at some deeper cuts to see how the numbers change.
Link building is a common activity in SEO and is absolutely important for ranking sites. We were interested in whether firms that build links charge more or less than firms that do not.
Here are the findings:
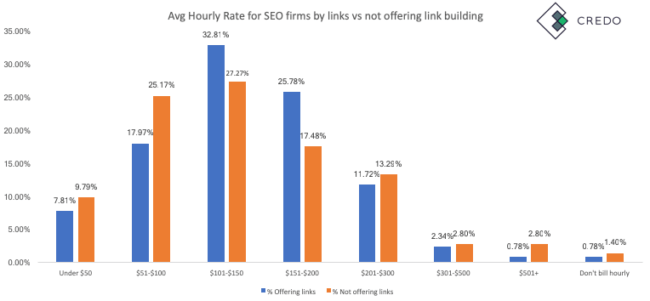
Takeaways:
Overall, this data surprises me a little bit, though then I remember that this is worldwide and the data skews lower than I usually think it will.
The figures I expected are that a higher percentage of links-offering firms bill between $101-$200 than non-links firms and that non-links firms charge more as a percentage in the higher hourly rates.
The other way we wanted to look at the data was by company size. Here are the results:
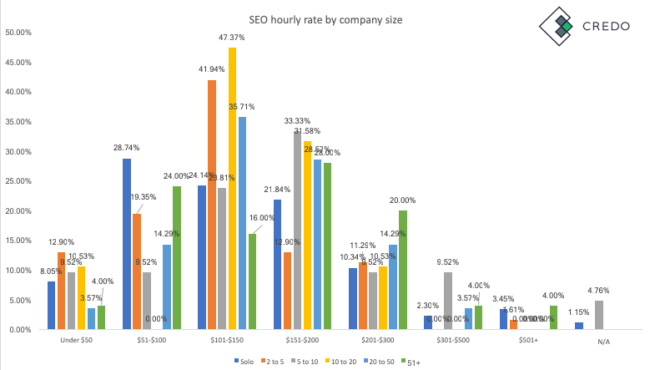
And here’s the data:
| Hourly Rate | Solo | 2 to 5 | 5 to 10 | 10 to 20 | 20 to 50 | 51+ |
| Under $50 | 8.05% | 12.90% | 9.52% | 10.53% | 3.57% | 4.00% |
| $51-$100 | 28.74% | 19.35% | 9.52% | 0.00% | 14.29% | 24.00% |
| $101-$150 | 24.14% | 41.94% | 23.81% | 47.37% | 35.71% | 16.00% |
| $151-$200 | 21.84% | 12.90% | 33.33% | 31.58% | 28.57% | 28.00% |
| $201-$300 | 10.34% | 11.29% | 9.52% | 10.53% | 14.29% | 20.00% |
| $301-$500 | 2.30% | 0.00% | 9.52% | 0.00% | 3.57% | 4.00% |
| $501+ | 3.45% | 1.61% | 0.00% | 0.00% | 0.00% | 4.00% |
| N/A | 1.15% | 4.76% |
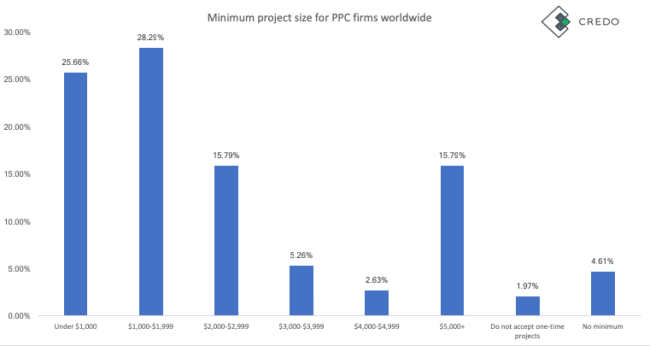
Here are the SEO firm minimum monthly one-time projects as reported by our 242 respondents:
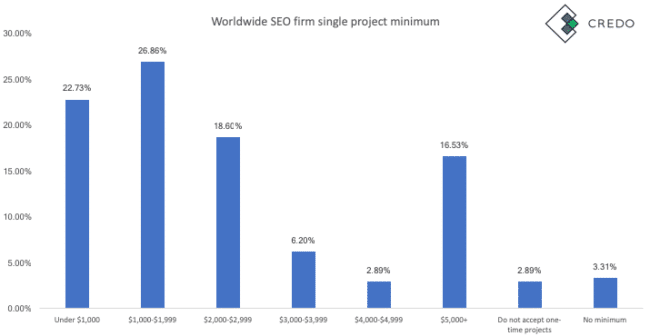
The raw data:
| Project minimum | Count of Single project minimum | Worldwide SEO firm single project minimum |
| Under $1,000 | 55 | 22.73% |
| $1,000-$1,999 | 65 | 26.86% |
| $2,000-$2,999 | 45 | 18.60% |
| $3,000-$3,999 | 15 | 6.20% |
| $4,000-$4,999 | 7 | 2.89% |
| $5,000+ | 40 | 16.53% |
| Do not accept one-time projects | 7 | 2.89% |
| No minimum | 8 | 3.31% |
The important takeaways:
Here are the SEO firm minimum monthly retainers worldwide as reported by our 242 respondents:
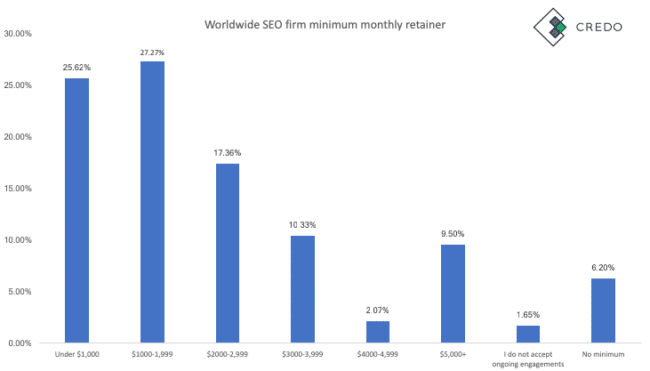
The raw data:
| Worldwide SEO firm minimum monthly retainer | ||
| Monthly retainer | Count of Monthly minimum budget | Worldwide SEO firm minimum monthly retainer |
| Under $1,000 | 62 | 25.62% |
| $1000-1,999 | 66 | 27.27% |
| $2000-2,999 | 42 | 17.36% |
| $3000-3,999 | 25 | 10.33% |
| $4000-4,999 | 5 | 2.07% |
| $5,000+ | 23 | 9.50% |
| I do not accept ongoing engagements | 4 | 1.65% |
| No minimum | 15 | 6.20% |
Now that we’ve established the worldwide SEO agency/firm rates, let’s look at the US numbers.
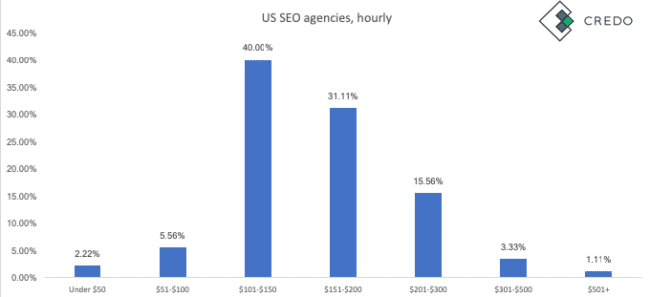
Here’s the raw data:
| Hourly Rate | SEO agencies |
| Under $50 | 2.22% |
| $51-$100 | 5.56% |
| $101-$150 | 40.00% |
| $151-$200 | 31.11% |
| $201-$300 | 15.56% |
| $301-$500 | 3.33% |
| $501+ | 1.11% |
The interesting callouts are:
Here are the US SEO firm minimum projects according to our 137 respondents:
The raw data:
| Project minimum | Count of Single project minimum | US SEO firm single project minimum |
| Under $1,000 | 22 | 16.06% |
| $1,000-$1,999 | 37 | 27.01% |
| $2,000-$2,999 | 32 | 23.36% |
| $3,000-$3,999 | 9 | 6.57% |
| $4,000-$4,999 | 3 | 2.19% |
| $5,000+ | 27 | 19.71% |
| Do not accept one-time projects | 3 | 2.19% |
| No minimum | 4 | 2.92% |
Here are the US SEO firm minimum monthly retainers according to our 137 respondents:
The raw data:
| US SEO firm minimum monthly retainer | ||
| Monthly retainer | Count of Monthly minimum budget | US SEO firm minimum monthly retainer |
| Under $1,000 | 25 | 18.25% |
| $1000-1,999 | 41 | 29.93% |
| $2000-2,999 | 28 | 20.44% |
| $3000-3,999 | 17 | 12.41% |
| $4000-4,999 | 4 | 2.92% |
| $5,000+ | 14 | 10.22% |
| I do not accept ongoing engagements | 1 | 0.73% |
| No minimum | 7 | 5.11% |
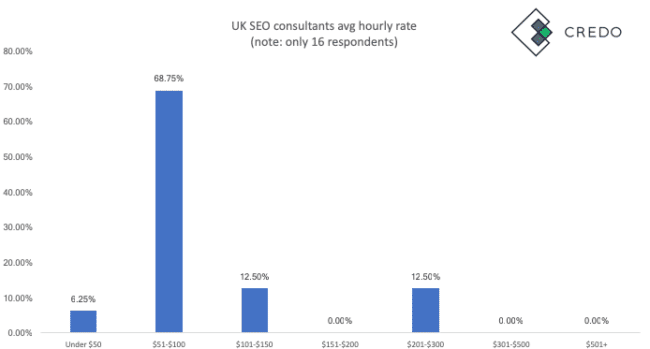
Now let’s look at UK SEO agency hourly rates numbers. We had significantly fewer UK agencies who do SEO respond than US (90 for US, 24 for UK) so these numbers are not as strong as US, but they’re still directionally helpful.
Here’s the raw data:
| Hourly Rate | UK SEO agencies |
| Under $50 | 8.33% |
| $51-$100 | 37.50% |
| $101-$150 | 29.17% |
| $151-$200 | 12.50% |
| $201-$300 | 12.50% |
| $301-$500 | 0.00% |
| $501+ | 0.00% |
Here are the main callouts:
Now let’s look at the average SEO agency (2+ people) rates both worldwide and for the United States.
Here are the SEO agency hourly rates worldwide for our 155 respondents:
The raw data:
| SEO agency hourly rates worldwide | ||
| Hourly rate | Count of Average hourly rate | SEO agency hourly rates worldwide |
| Under $50 | 14 | 9.03% |
| $51-$100 | 24 | 15.48% |
| $101-$150 | 54 | 34.84% |
| $151-$200 | 36 | 23.23% |
| $201-$300 | 20 | 12.90% |
| $301-$500 | 4 | 2.58% |
| $501+ | 2 | 1.29% |
| N/A | 1 | 0.65% |
Here are the worldwide SEO agency projects minimums as reported by our 155 respondents:
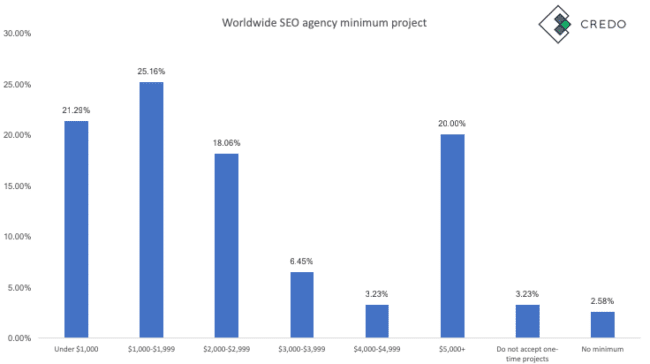
The raw data:
| Worldwide SEO agency minimum project | ||
| Project minimum | Count of Single project minimum | Worldwide SEO agency minimum project |
| Under $1,000 | 33 | 21.29% |
| $1,000-$1,999 | 39 | 25.16% |
| $2,000-$2,999 | 28 | 18.06% |
| $3,000-$3,999 | 10 | 6.45% |
| $4,000-$4,999 | 5 | 3.23% |
| $5,000+ | 31 | 20.00% |
| Do not accept one-time projects | 5 | 3.23% |
| No minimum | 4 | 2.58% |
Here are the worldwide SEO agency minimum monthly retainers as reported by our 155 respondents:
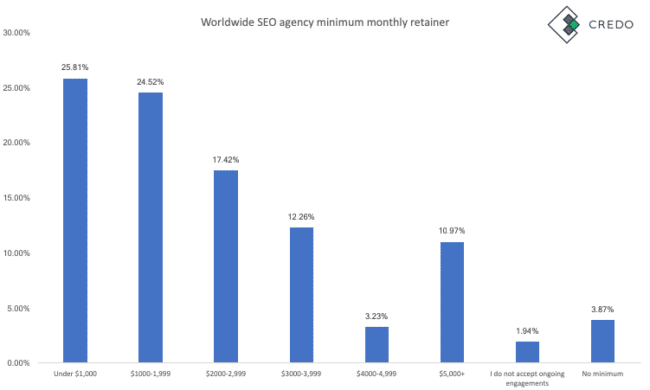
The raw data:
| Worldwide SEO agency minimum monthly retainer | ||
| Row Labels | Count of Monthly minimum budget | Worldwide SEO agency minimum monthly retainer |
| Under $1,000 | 40 | 25.81% |
| $1000-1,999 | 38 | 24.52% |
| $2000-2,999 | 27 | 17.42% |
| $3000-3,999 | 19 | 12.26% |
| $4000-4,999 | 5 | 3.23% |
| $5,000+ | 17 | 10.97% |
| I do not accept ongoing engagements | 3 | 1.94% |
| No minimum | 6 | 3.87% |
Before digging into the average SEO consultant rates in US and UK, let’s look at them worldwide.
The average SEO consultant hourly rate worldwide as of January 2019 is $148 per hour.
Here is the data:
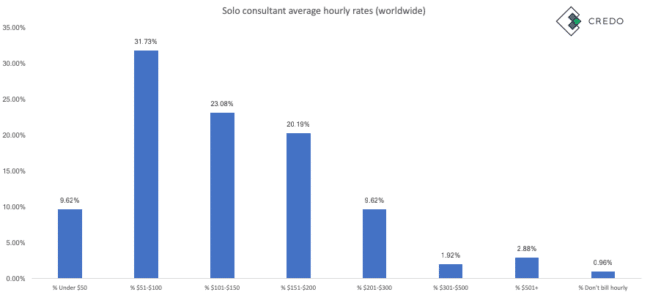
And the data:
| Hourly Rate | Solo |
| Under $50 | 8.05% |
| $51-$100 | 28.74% |
| $101-$150 | 24.14% |
| $151-$200 | 21.84% |
| $201-$300 | 10.34% |
| $301-$500 | 2.30% |
| $501+ | 3.45% |
| N/A | 1.15% |
As you can see, the average is $148 per hour but the takeaways are:
Here are the worldwide SEO consultant project minimums from our 87 respondents:
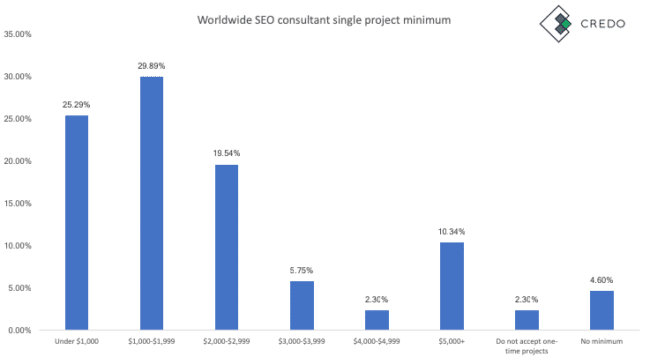
The raw data:
| Worldwide SEO consultant single project minimum | ||
| Row Labels | Count of Single project minimum | Worldwide SEO consultant single project minimum |
| Under $1,000 | 22 | 25.29% |
| $1,000-$1,999 | 26 | 29.89% |
| $2,000-$2,999 | 17 | 19.54% |
| $3,000-$3,999 | 5 | 5.75% |
| $4,000-$4,999 | 2 | 2.30% |
| $5,000+ | 9 | 10.34% |
| Do not accept one-time projects | 2 | 2.30% |
| No minimum | 4 | 4.60% |
Here are the worldwide SEO consultant monthly retainer minimums from our 87 respondents:
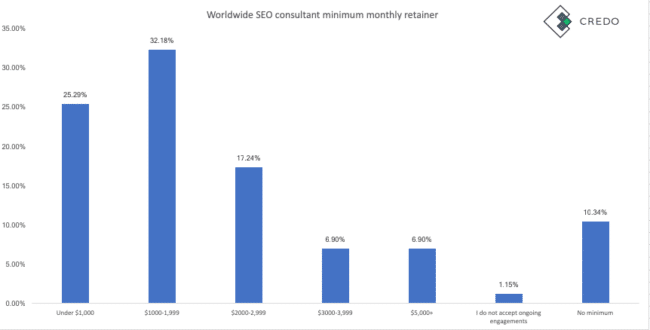
The raw data:
| Worldwide SEO consultant minimum monthly retainer | ||
| Row Labels | Count of Monthly minimum budget | Worldwide SEO consultant minimum monthly retainer |
| Under $1,000 | 22 | 25.29% |
| $1000-1,999 | 28 | 32.18% |
| $2000-2,999 | 15 | 17.24% |
| $3000-3,999 | 6 | 6.90% |
| $5,000+ | 6 | 6.90% |
| I do not accept ongoing engagements | 1 | 1.15% |
| No minimum | 9 | 10.34% |
Now let’s look at US SEO consultant (only 1 person in the company) rates. We had 47 such respondents.
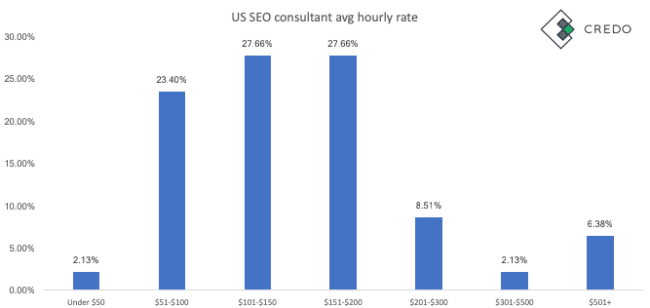
Here’s the raw data:
| Hourly Rate | US SEO consultants |
| Under $50 | 2.13% |
| $51-$100 | 23.40% |
| $101-$150 | 27.66% |
| $151-$200 | 27.66% |
| $201-$300 | 8.51% |
| $301-$500 | 2.13% |
| $501+ | 6.38% |
The interesting callouts are:
Here are the single project minimums for the 47 US SEO consultants in our dataset:
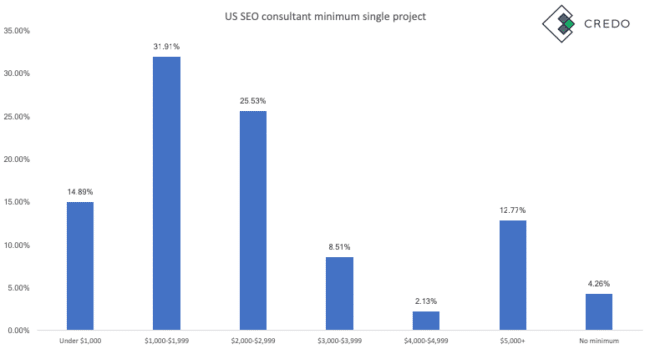
The raw data:
| US SEO consultant minimum single project | ||
| Row Labels | Count of Single project minimum | US SEO consultant minimum single project |
| Under $1,000 | 7 | 14.89% |
| $1,000-$1,999 | 15 | 31.91% |
| $2,000-$2,999 | 12 | 25.53% |
| $3,000-$3,999 | 4 | 8.51% |
| $4,000-$4,999 | 1 | 2.13% |
| $5,000+ | 6 | 12.77% |
| No minimum | 2 | 4.26% |
Here are the monthly retainer minimums for the 47 US SEO consultants in our dataset:
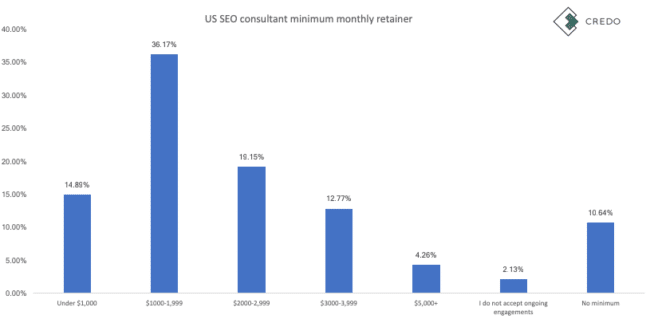
The raw data:
| US SEO consultant minimum monthly retainer | ||
| Monthly retainer | Count of Monthly minimum budget | US SEO consultant minimum monthly retainer |
| Under $1,000 | 7 | 14.89% |
| $1000-1,999 | 17 | 36.17% |
| $2000-2,999 | 9 | 19.15% |
| $3000-3,999 | 6 | 12.77% |
| $5,000+ | 2 | 4.26% |
| I do not accept ongoing engagements | 1 | 2.13% |
| No minimum | 5 | 10.64% |
Similarly to the SEO agencies, we had dramatically fewer UK respondents than US respondents. We had 47 respondents in the US versus just 16 in the UK.
As such it’s barely worthwhile to give averages as they are so skewed, so here is the raw data:
| Hourly Rate for UK SEO consultants | Count |
| Under $50 | 1 |
| $51-$100 | 11 |
| $101-$150 | 2 |
| $151-$200 | 0 |
| $201-$300 | 2 |
| $301-$500 | 0 |
| $501+ | 0 |
If you really want the averages, here they are:
Because we do not have enough data here, we will not call out interesting pullouts.
Every always asks us “how much does a PPC agency cost?”, to which we explain that it depends on many factors such as but not limited to their location, their size, the type of work they’re offering (services, strategy, or both), and how senior they are.
We crunched the numbers that came back from our survey to find the answer for you to begin with though. The way to interpret this data is to remember that these are averages and a starting point for a conversation, but depending on how you pull the levers a firm will be more or less expensive. We have tried to slice and dice the data for you so that you can see how this happens on average.
But once again, it will depend on the factors listed above. An agency based in New York City will usually cost more than an agency in Kalamazoo, Michigan simply because of the average price of talent.
So let’s look at the data.
Tired of not closing enough consulting clients? Download our free guide to closing more of the prospects you pitch.
Oops! We could not locate your form.
Interesting takeaways from this section:
A quick caveat that we only noticed after putting together this section is that we did not specify in the survey whether this was client spend or the firm’s take from the project for project minimums and monthly retainers. So, the data for those sections should be viewed directionally.
First let’s look at the average rates of PPC firms worldwide.
Here are the PPC firm worldwide hourly rates, for all company sizes:
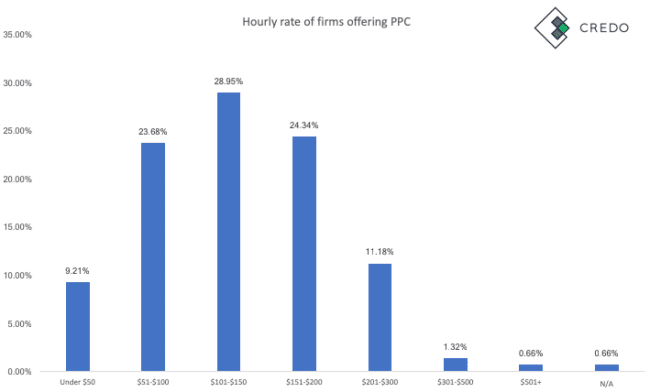
The raw data:
| Hourly Rate | Count of Average hourly rate | All firms offering PPC |
| Under $50 | 14 | 9.21% |
| $51-$100 | 36 | 23.68% |
| $101-$150 | 44 | 28.95% |
| $151-$200 | 37 | 24.34% |
| $201-$300 | 17 | 11.18% |
| $301-$500 | 2 | 1.32% |
| $501+ | 1 | 0.66% |
| N/A | 1 | 0.66% |
Here are the project minimums that the PPC firms across the world reported that they take:
The raw data:
| Project minimum | Count of Single project minimum | Percentage of total |
| Under $1,000 | 39 | 25.66% |
| $1,000-$1,999 | 43 | 28.29% |
| $2,000-$2,999 | 24 | 15.79% |
| $3,000-$3,999 | 8 | 5.26% |
| $4,000-$4,999 | 4 | 2.63% |
| $5,000+ | 24 | 15.79% |
| Do not accept one-time projects | 3 | 1.97% |
| No minimum | 7 | 4.61% |
Here are the single project minimums for PPC firms worldwide, based on company size:
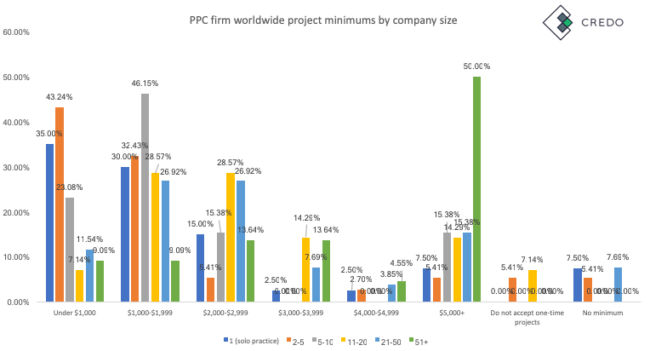
That chart is a bit busy, so here is the raw data:
| Project minimum | 1 (solo practice) | 2-5 | 5-10 | 11-20 | 21-50 | 51+ |
| Under $1,000 | 35.00% | 43.24% | 23.08% | 7.14% | 11.54% | 9.09% |
| $1,000-$1,999 | 30.00% | 32.43% | 46.15% | 28.57% | 26.92% | 9.09% |
| $2,000-$2,999 | 15.00% | 5.41% | 15.38% | 28.57% | 26.92% | 13.64% |
| $3,000-$3,999 | 2.50% | 0.00% | 0.00% | 14.29% | 7.69% | 13.64% |
| $4,000-$4,999 | 2.50% | 2.70% | 0.00% | 0.00% | 3.85% | 4.55% |
| $5,000+ | 7.50% | 5.41% | 15.38% | 14.29% | 15.38% | 50.00% |
| Do not accept one-time projects | 0.00% | 5.41% | 0.00% | 7.14% | 0.00% | 0.00% |
| No minimum | 7.50% | 5.41% | 0.00% | 0.00% | 7.69% | 0.00% |
The interesting takeaways in this section are:
Here are the PPC firm worldwide monthly retainer rates as reported by our 152 respondents:
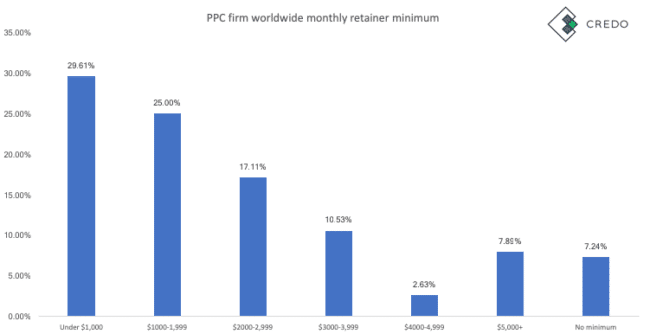
The raw data:
| PPC firm worldwide monthly retainer minimum | ||
| Row Labels | Count of Monthly minimum budget | PPC firm worldwide monthly retainer minimum |
| Under $1,000 | 45 | 29.61% |
| $1000-1,999 | 38 | 25.00% |
| $2000-2,999 | 26 | 17.11% |
| $3000-3,999 | 16 | 10.53% |
| $4000-4,999 | 4 | 2.63% |
| $5,000+ | 12 | 7.89% |
| No minimum | 11 | 7.24% |
Interesting takeaways include:
Here are the average rates for US and UK PPC firms.
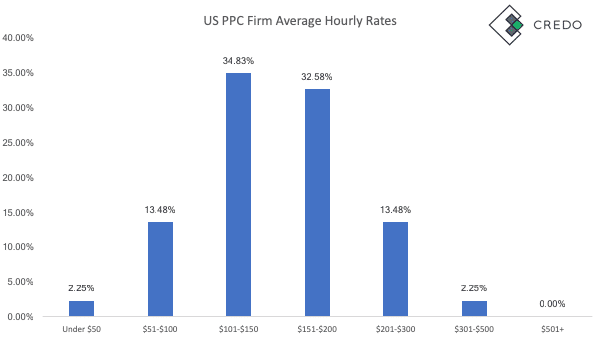
The raw data:
| Hourly Rate | Count | PPC firm US |
| Under $50 | 2 | 2.25% |
| $51-$100 | 12 | 13.48% |
| $101-$150 | 31 | 34.83% |
| $151-$200 | 29 | 32.58% |
| $201-$300 | 12 | 13.48% |
| $301-$500 | 2 | 2.25% |
| $501+ | 0 | 0.00% |
Here are the average hourly rates for UK PPC firms:
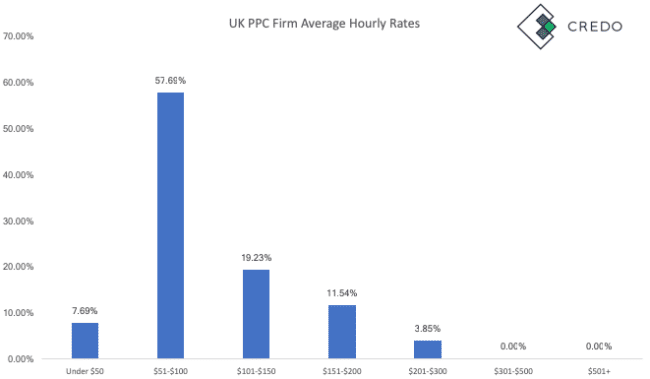
The raw data:
| Hourly Rate | Count | PPC firm UK |
| Under $50 | 2 | 7.69% |
| $51-$100 | 15 | 57.69% |
| $101-$150 | 5 | 19.23% |
| $151-$200 | 3 | 11.54% |
| $201-$300 | 1 | 3.85% |
| $301-$500 | 0 | 0.00% |
| $501+ | 0 | 0.00% |
UK PPC firms need to charge more!
Now let’s look at average PPC agency rates.
Here are the worldwide PPC agency average hourly rates:
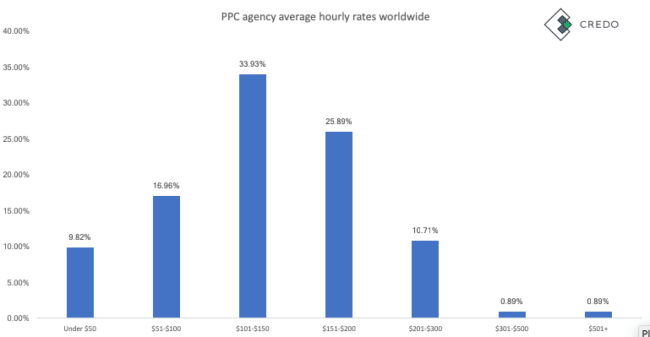
Raw data:
| Hourly Rate | Count | PPC agency hourly |
| Under $50 | 11 | 9.82% |
| $51-$100 | 19 | 16.96% |
| $101-$150 | 38 | 33.93% |
| $151-$200 | 29 | 25.89% |
| $201-$300 | 12 | 10.71% |
| $301-$500 | 1 | 0.89% |
| $501+ | 1 | 0.89% |
Here are the reported project minimums for the PPC agencies in our dataset, of which there are 112:
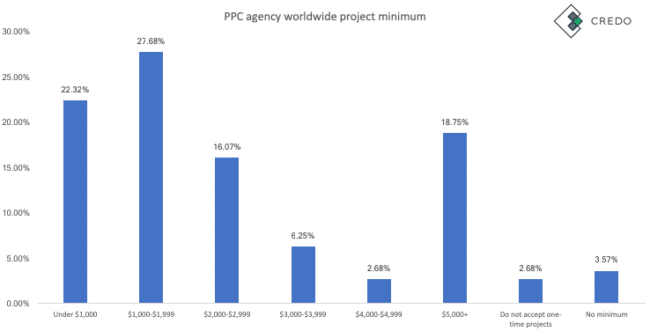
The raw data:
| Row Labels | Count of Single project minimum | PPC agency worldwide project minimum |
| Under $1,000 | 25 | 22.32% |
| $1,000-$1,999 | 31 | 27.68% |
| $2,000-$2,999 | 18 | 16.07% |
| $3,000-$3,999 | 7 | 6.25% |
| $4,000-$4,999 | 3 | 2.68% |
| $5,000+ | 21 | 18.75% |
| Do not accept one-time projects | 3 | 2.68% |
| No minimum | 4 | 3.57% |
Here are the US PPC agency project minimums from our dataset:
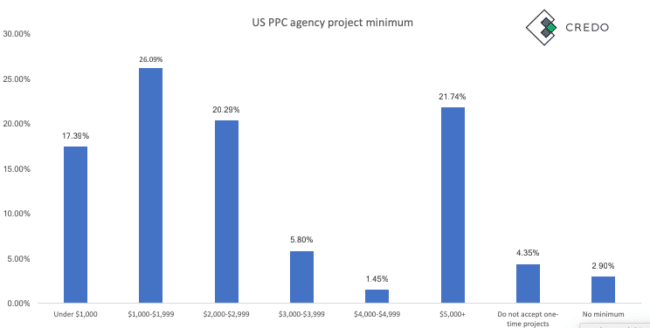
The raw data:
| Row Labels | Count of Single project minimum | PPC agency project minimum |
| Under $1,000 | 12 | 17.39% |
| $1,000-$1,999 | 18 | 26.09% |
| $2,000-$2,999 | 14 | 20.29% |
| $3,000-$3,999 | 4 | 5.80% |
| $4,000-$4,999 | 1 | 1.45% |
| $5,000+ | 15 | 21.74% |
| Do not accept one-time projects | 3 | 4.35% |
| No minimum | 2 | 2.90% |
Interesting takeaways from this section are:
Here are the worldwide PPC agency retainer minimums from our 112 respondents:
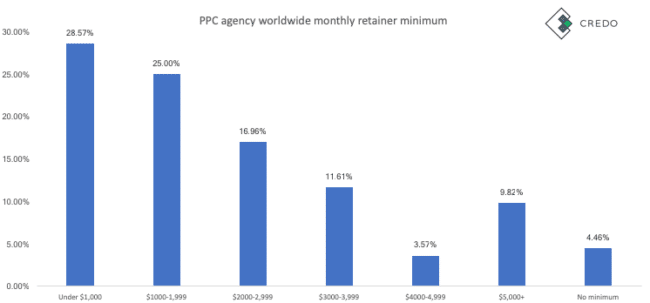
The raw data:
| PPC agency worldwide monthly retainer minimum | ||
| Row Labels | Count of Monthly minimum budget | PPC agency worldwide monthly retainer minimum |
| Under $1,000 | 32 | 28.57% |
| $1000-1,999 | 28 | 25.00% |
| $2000-2,999 | 19 | 16.96% |
| $3000-3,999 | 13 | 11.61% |
| $4000-4,999 | 4 | 3.57% |
| $5,000+ | 11 | 9.82% |
| No minimum | 5 | 4.46% |
Here are the US PPC agency monthly retainer minimums as reported by our 69 respondents:
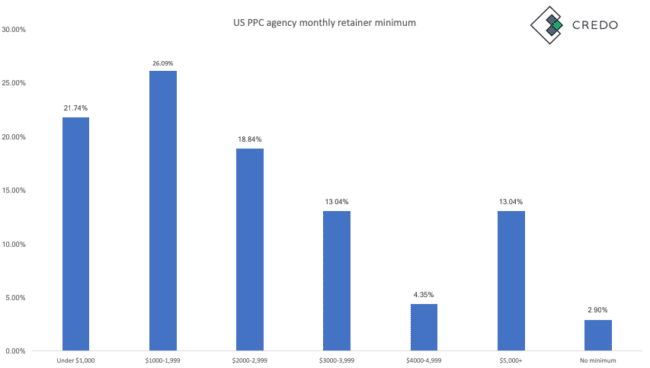
The raw data:
| Retainer minimum | Count of Monthly minimum budget | US PPC agency monthly retainer minimum |
| Under $1,000 | 15 | 21.74% |
| $1000-1,999 | 18 | 26.09% |
| $2000-2,999 | 13 | 18.84% |
| $3000-3,999 | 9 | 13.04% |
| $4000-4,999 | 3 | 4.35% |
| $5,000+ | 9 | 13.04% |
| No minimum | 2 | 2.90% |
Interesting takeaways include:
US PPC agencies are, from our data, more expensive than the worldwide averages.
Now let’s look at PPC consultant rates worldwide and US specific.
Here are the PPC consultant worldwide hourly rates from our dataset containing 40 PPC consultants:
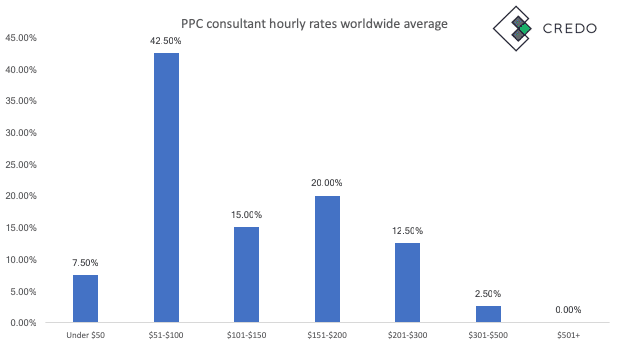
The raw data:
| Hourly Rate | Count | PPC consultant hourly rates |
| Under $50 | 3 | 7.50% |
| $51-$100 | 17 | 42.50% |
| $101-$150 | 6 | 15.00% |
| $151-$200 | 8 | 20.00% |
| $201-$300 | 5 | 12.50% |
| $301-$500 | 1 | 2.50% |
| $501+ | 0 | 0.00% |
Here are the PPC consultant worldwide project minimums, of which there were 40 respondents:
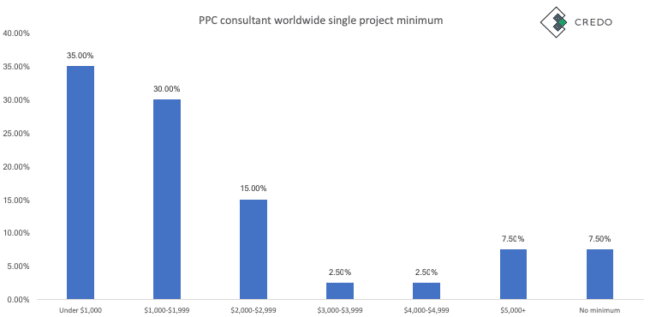
The raw data:
| PPC consultant worldwide single project minimum | ||
| Row Labels | Count of Single project minimum | PPC consultant worldwide |
| Under $1,000 | 14 | 35.00% |
| $1,000-$1,999 | 12 | 30.00% |
| $2,000-$2,999 | 6 | 15.00% |
| $3,000-$3,999 | 1 | 2.50% |
| $4,000-$4,999 | 1 | 2.50% |
| $5,000+ | 3 | 7.50% |
| No minimum | 3 | 7.50% |
Here are the US PPC consultant projects minimums from our dataset, in which there were 20 respondents. Thus, we are showing the raw numbers here instead of percentages:
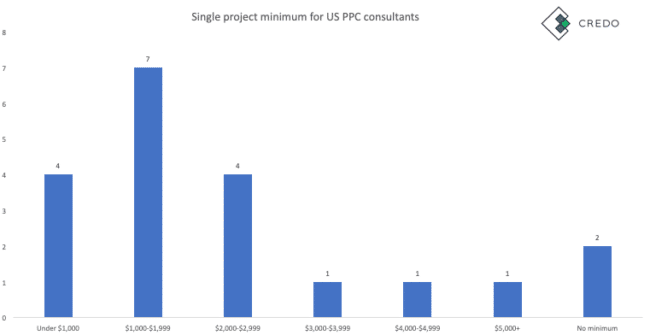
The raw data:
| US PPC consultant project minimums | |
| Single project minimum | Count |
| Under $1,000 | 4 |
| $1,000-$1,999 | 7 |
| $2,000-$2,999 | 4 |
| $3,000-$3,999 | 1 |
| $4,000-$4,999 | 1 |
| $5,000+ | 1 |
| No minimum | 2 |
Here are the PPC consultant worldwide monthly retainer minimums from the 40 respondents in our dataset:
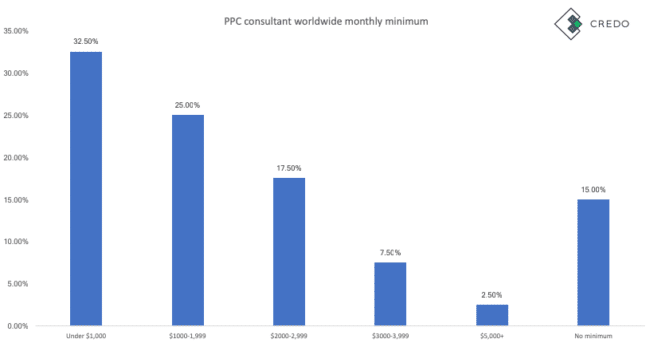
The raw data:
| PPC consultant worldwide monthly minimum | ||
| Monthly retainer minimum | Count of Monthly minimum budget | PPC consultant worldwide monthly minimum |
| Under $1,000 | 13 | 32.50% |
| $1000-1,999 | 10 | 25.00% |
| $2000-2,999 | 7 | 17.50% |
| $3000-3,999 | 3 | 7.50% |
| $5,000+ | 1 | 2.50% |
| No minimum | 6 | 15.00% |
Tired of not closing enough consulting clients? Download our free guide to closing more of the prospects you pitch.
Oops! We could not locate your form.

Facebook ads are still the newest addition to the go-to marketing channels for most companies. We still will frequently be told “Oh, our audience isn’t on Facebook” when speaking with prospective clients looking to hire an agency here at Credo.
The reality is that EVERYONE (and their mother, literally) is on Facebook and it is an incredibly powerful channel for advertising and business. When they began slashing organic reach in 2014, advertising became even more important to reaching your audience on Facebook.
The important takeaways from this section are:
Let’s get into the numbers.
Tired of not closing enough consulting clients? Download our free guide to closing more of the prospects you pitch.
Oops! We could not locate your form.
For this 2019 survey, we had 127 firms respond that they do Facebook advertising for clients.
We found that on average, firms reporting that they run Facebook ads for clients charge $137.50 per hour for their work.
Here is their breakdown of reported hourly rate ranges:
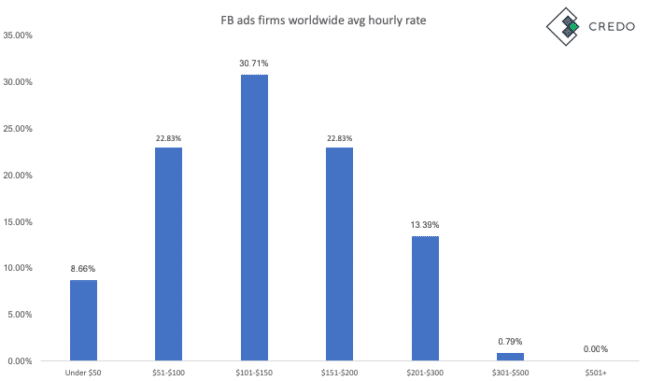
And the raw data:
| Hourly Rate | Count | FB ads firms worldwide |
| Under $50 | 11 | 8.66% |
| $51-$100 | 29 | 22.83% |
| $101-$150 | 39 | 30.71% |
| $151-$200 | 29 | 22.83% |
| $201-$300 | 17 | 13.39% |
| $301-$500 | 1 | 0.79% |
| $501+ | 0 | 0.00% |
The important callouts here are:
Here are the average hourly rates for US-based Facebook ads firms (all company sizes including solo consultants):
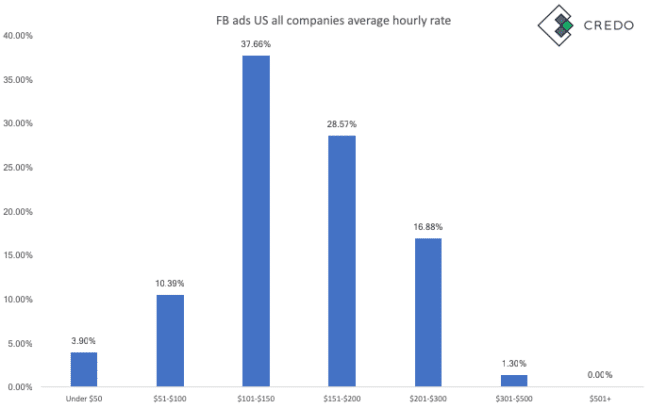
Here is the raw data:
| Hourly Rate | Count | FB ads US all sizes |
| Under $50 | 3 | 3.90% |
| $51-$100 | 8 | 10.39% |
| $101-$150 | 29 | 37.66% |
| $151-$200 | 22 | 28.57% |
| $201-$300 | 13 | 16.88% |
| $301-$500 | 1 | 1.30% |
| $501+ | 0 | 0.00% |
Here you can see that the percentage charging between $100-$200 per hour is even more than worldwide at 66.23% of all our respondents!
From this, we can see that most of the lower-charging firms in our dataset are not US-based.
Here are the project minimums as reported by the 127 Facebook ads respondents in our dataset:
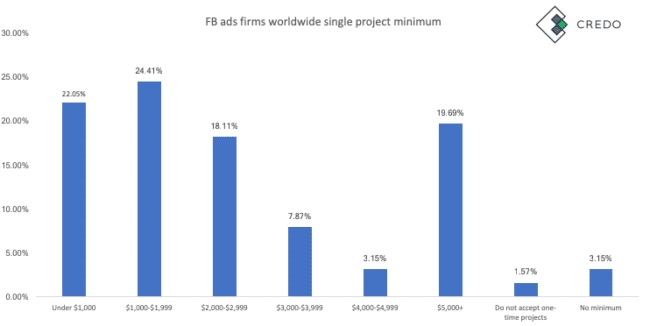
The raw data:
| FB ads firms worldwide single project minimum | ||
| Row Labels | Count of Single project minimum | FB ads firms worldwide single project minimum |
| Under $1,000 | 28 | 22.05% |
| $1,000-$1,999 | 31 | 24.41% |
| $2,000-$2,999 | 23 | 18.11% |
| $3,000-$3,999 | 10 | 7.87% |
| $4,000-$4,999 | 4 | 3.15% |
| $5,000+ | 25 | 19.69% |
| Do not accept one-time projects | 2 | 1.57% |
| No minimum | 4 | 3.15% |
Here are the monthly retainer minimums worldwide as reported by the 127 Facebook ads respondents in our dataset:
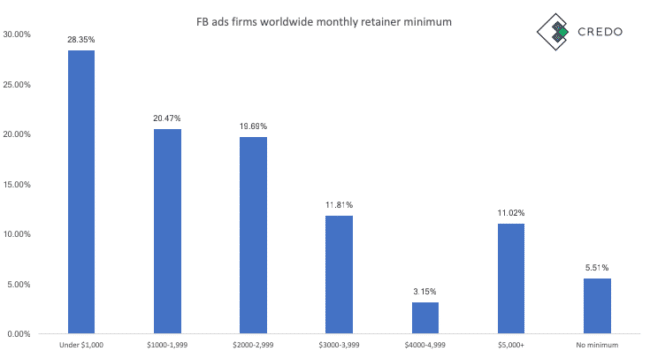
The raw data:
| FB ads firms worldwide monthly retainer minimum | ||
| Row Labels | Count of Monthly minimum budget | FB ads firms worldwide monthly retainer minimum |
| Under $1,000 | 36 | 28.35% |
| $1000-1,999 | 26 | 20.47% |
| $2000-2,999 | 25 | 19.69% |
| $3000-3,999 | 15 | 11.81% |
| $4000-4,999 | 4 | 3.15% |
| $5,000+ | 14 | 11.02% |
| No minimum | 7 | 5.51% |
Here the rates for the Facebook ads agencies (2+ full time employees) within our dataset.
Here are the worldwide Facebook ads agency average hourly rates for our dataset. There were 96 respondents in this bucket:
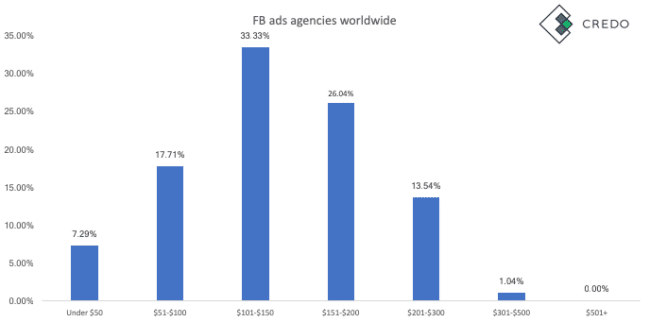
Here is the raw data:
| Hourly Rate | Count | FB ads agencies worldwide |
| Under $50 | 7 | 7.29% |
| $51-$100 | 17 | 17.71% |
| $101-$150 | 32 | 33.33% |
| $151-$200 | 25 | 26.04% |
| $201-$300 | 13 | 13.54% |
| $301-$500 | 1 | 1.04% |
| $501+ | 0 | 0.00% |
The interesting numbers for us are:
Here are the worldwide Facebook ads agencies single project minimums according to the 96 respondents in our dataset:
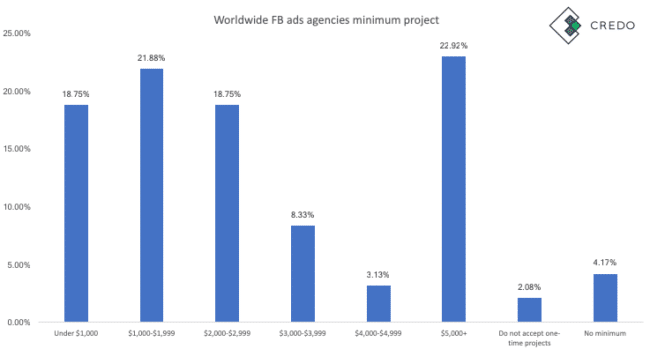
The raw data:
| Worldwide FB ads agencies minimum project | ||
| Row Labels | Count of Single project minimum | Worldwide FB ads agencies minimum project |
| Under $1,000 | 18 | 18.75% |
| $1,000-$1,999 | 21 | 21.88% |
| $2,000-$2,999 | 18 | 18.75% |
| $3,000-$3,999 | 8 | 8.33% |
| $4,000-$4,999 | 3 | 3.13% |
| $5,000+ | 22 | 22.92% |
| Do not accept one-time projects | 2 | 2.08% |
| No minimum | 4 | 4.17% |
Here are the worldwide Facebook ads agencies monthly retainer minimums according to the 96 respondents in our dataset:
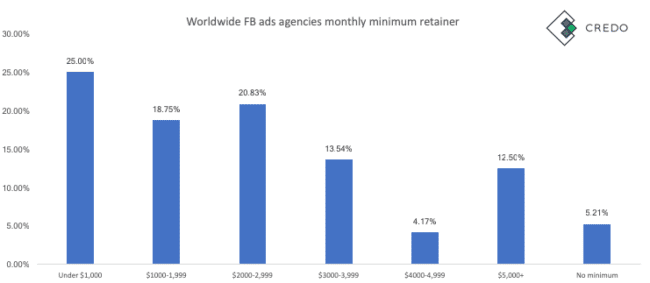
The raw data:
| Worldwide FB ads agencies monthly minimum retainer | ||
| Row Labels | Count of Monthly minimum budget | Worldwide FB ads agencies monthly minimum retainer |
| Under $1,000 | 24 | 25.00% |
| $1000-1,999 | 18 | 18.75% |
| $2000-2,999 | 20 | 20.83% |
| $3000-3,999 | 13 | 13.54% |
| $4000-4,999 | 4 | 4.17% |
| $5,000+ | 12 | 12.50% |
| No minimum | 5 | 5.21% |
Here are the hourly rate numbers for the 58 US-based Facebook ads agencies in our dataset:
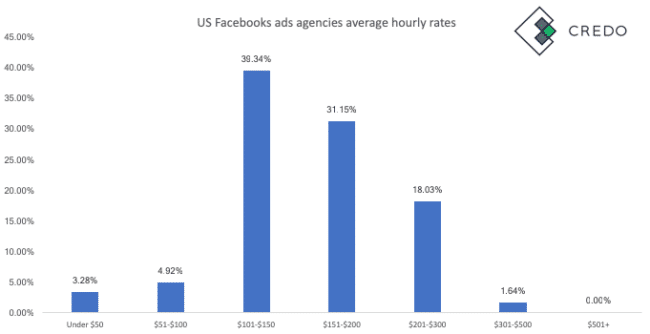
And the raw data:
| Hourly Rate | Count | FB ads US and agencies |
| Under $50 | 2 | 3.28% |
| $51-$100 | 3 | 4.92% |
| $101-$150 | 24 | 39.34% |
| $151-$200 | 19 | 31.15% |
| $201-$300 | 11 | 18.03% |
| $301-$500 | 1 | 1.64% |
| $501+ | 0 | 0.00% |
The interesting callouts are:
Here the rates for the Facebook ads consultants (only 1 full time employee, may work with outside freelancers) within our dataset.
Here are the numbers for the Facebook ads consultant from within our dataset, of which there were 31. The raw data is important to pay attention to below the chart:
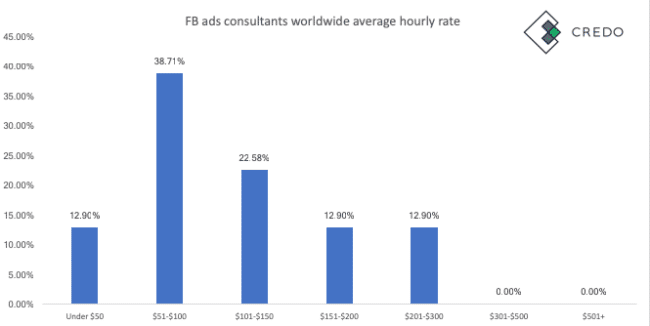
The raw data:
| Hourly Rate | Count | FB ads consultants worldwide |
| Under $50 | 4 | 12.90% |
| $51-$100 | 12 | 38.71% |
| $101-$150 | 7 | 22.58% |
| $151-$200 | 4 | 12.90% |
| $201-$300 | 4 | 12.90% |
| $301-$500 | 0 | 0.00% |
| $501+ | 0 | 0.00% |
Here are the single project minimums for the 31 Facebook ads consultants from within our dataset:
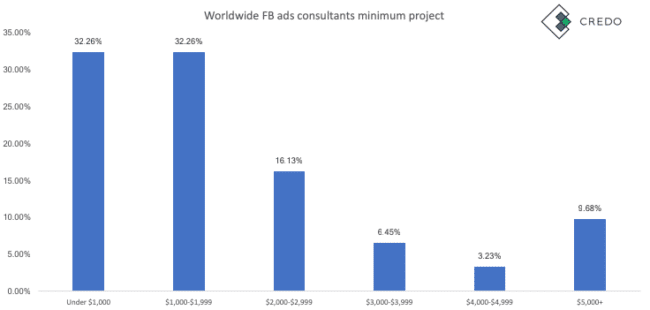
The raw data:
| Worldwide FB ads consultants minimum project | ||
| Row Labels | Count of Single project minimum | Worldwide FB ads consultants minimum project |
| Under $1,000 | 10 | 32.26% |
| $1,000-$1,999 | 10 | 32.26% |
| $2,000-$2,999 | 5 | 16.13% |
| $3,000-$3,999 | 2 | 6.45% |
| $4,000-$4,999 | 1 | 3.23% |
| $5,000+ | 3 | 9.68% |
Here are the monthly retainer minimums for the 31 Facebook ads consultants from within our dataset:
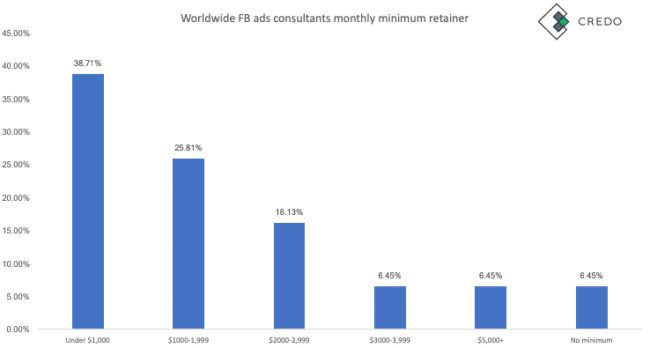
The raw data:
| Worldwide FB ads consultants monthly minimum retainer | ||
| Row Labels | Count of Monthly minimum budget | Worldwide FB ads consultants monthly minimum retainer |
| Under $1,000 | 12 | 38.71% |
| $1000-1,999 | 8 | 25.81% |
| $2000-2,999 | 5 | 16.13% |
| $3000-3,999 | 2 | 6.45% |
| $5,000+ | 2 | 6.45% |
| No minimum | 2 | 6.45% |
Here are the average hourly rates as reported by the US-based Facebook ads solo consultants from our dataset, of which there were 16:
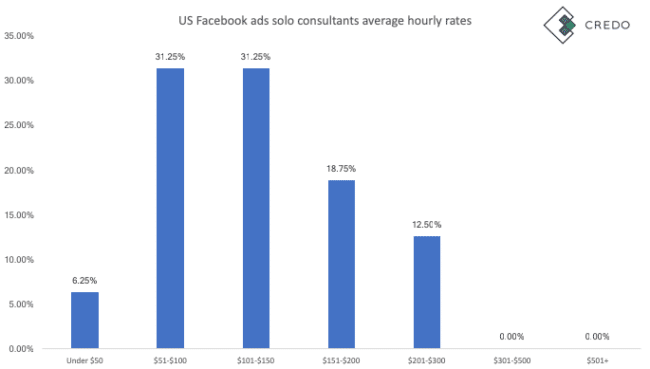
The raw data:
| Hourly Rate | Count | FB ads US and solo consultants |
| Under $50 | 1 | 6.25% |
| $51-$100 | 5 | 31.25% |
| $101-$150 | 5 | 31.25% |
| $151-$200 | 3 | 18.75% |
| $201-$300 | 2 | 12.50% |
| $301-$500 | 0 | 0.00% |
| $501+ | 0 | 0.00% |
From this data it looks like US based solo Facebook ads consultants charge less per hour for their work than Facebook ads agencies. We don’t quite have enough consultants to say that for sure though.
That would not surprise us a lot though as it would be similar to how the SEO world evolved – agencies got more expensive then consultants specialized and raised their rates as they had the years of experience.
Tired of not closing enough consulting clients? Download our free guide to closing more of the prospects you pitch.
Oops! We could not locate your form.
Something we often get asked for is an agency rate card, otherwise known as a price list.
The reality is that such a thing does not exist across the industry because every agency or consultant charges different prices for different services. Strategy tends to be more expensive than services, but both can be lumped under the same term such as “SEO”, though these should more often be broken out as “SEO consulting” and “SEO services” depending on what is being done.
Buying digital marketing services on the high end is like shopping for a new car. You (probably!) don’t walk into a dealership, see a car for $45,000, and say “I’ll take it”. Instead you look at its miles, its ratings, its reviews, and ultimately you haggle on the price a bit. Ultimately, there is some salesmanship involved.
On the low end, you might be willing to just pay $2,500 for a car unseen if you want a clunker or don’t care how long it lasts. But you’re getting what you’ve paid for.
That said, we can absolutely get a high-level view of how much agencies and consultants charge for digital marketing. This encompasses both strategy and services.
Throughout the rest of this guide I have also broken down the different areas of digital marketing and how pricing changes for those specific channels, so be sure to check out the other chapters as well.
Tired of not closing enough consulting clients? Download our free guide to closing more of the prospects you pitch.
Oops! We could not locate your form.
Without further ado, here is the digital agency rate card and price list as gathered from our 271 survey respondents.
| SEO agency hourly rates worldwide | ||
| Hourly rate | Count of Average hourly rate | SEO agency hourly rates worldwide |
| Under $50 | 14 | 9.03% |
| $51-$100 | 24 | 15.48% |
| $101-$150 | 54 | 34.84% |
| $151-$200 | 36 | 23.23% |
| $201-$300 | 20 | 12.90% |
| $301-$500 | 4 | 2.58% |
| $501+ | 2 | 1.29% |
| N/A | 1 | 0.65% |
| SEO agency rates US only | |
| Hourly Rate | SEO agencies |
| Under $50 | 2.22% |
| $51-$100 | 5.56% |
| $101-$150 | 40.00% |
| $151-$200 | 31.11% |
| $201-$300 | 15.56% |
| $301-$500 | 3.33% |
| $501+ | 1.11% |
| Worldwide SEO firm single project minimum | ||
| Project minimum | Count of Single project minimum | Worldwide SEO firm single project minimum |
| Under $1,000 | 55 | 22.73% |
| $1,000-$1,999 | 65 | 26.86% |
| $2,000-$2,999 | 45 | 18.60% |
| $3,000-$3,999 | 15 | 6.20% |
| $4,000-$4,999 | 7 | 2.89% |
| $5,000+ | 40 | 16.53% |
| Do not accept one-time projects | 7 | 2.89% |
| No minimum | 8 | 3.31% |
| Worldwide SEO firm minimum monthly retainer | ||
| Monthly retainer | Count of Monthly minimum budget | Worldwide SEO firm minimum monthly retainer |
| Under $1,000 | 62 | 25.62% |
| $1000-1,999 | 66 | 27.27% |
| $2000-2,999 | 42 | 17.36% |
| $3000-3,999 | 25 | 10.33% |
| $4000-4,999 | 5 | 2.07% |
| $5,000+ | 23 | 9.50% |
| I do not accept ongoing engagements | 4 | 1.65% |
| No minimum | 15 | 6.20% |
| Worldwide PPC agency hourly rates | ||
| Hourly rate | Count | PPC agency hourly |
| Under $50 | 11 | 9.82% |
| $51-$100 | 19 | 16.96% |
| $101-$150 | 38 | 33.93% |
| $151-$200 | 29 | 25.89% |
| $201-$300 | 12 | 10.71% |
| $301-$500 | 1 | 0.89% |
| $501+ | 1 | 0.89% |
| Worldwide PPC agency single project minimums | ||
| Row Labels | Count of Single project minimum | PPC agency worldwide project minimum |
| Under $1,000 | 25 | 22.32% |
| $1,000-$1,999 | 31 | 27.68% |
| $2,000-$2,999 | 18 | 16.07% |
| $3,000-$3,999 | 7 | 6.25% |
| $4,000-$4,999 | 3 | 2.68% |
| $5,000+ | 21 | 18.75% |
| Do not accept one-time projects | 3 | 2.68% |
| No minimum | 4 | 3.57% |
| PPC agency worldwide monthly retainer minimum | ||
| Row Labels | Count of Monthly minimum budget | PPC agency worldwide monthly retainer minimum |
| Under $1,000 | 32 | 28.57% |
| $1000-1,999 | 28 | 25.00% |
| $2000-2,999 | 19 | 16.96% |
| $3000-3,999 | 13 | 11.61% |
| $4000-4,999 | 4 | 3.57% |
| $5,000+ | 11 | 9.82% |
| No minimum | 5 | 4.46% |
| Worldwide Facebook ads agencies hourly rate | ||
| Hourly Rate | Count | FB ads agencies worldwide |
| Under $50 | 7 | 7.29% |
| $51-$100 | 17 | 17.71% |
| $101-$150 | 32 | 33.33% |
| $151-$200 | 25 | 26.04% |
| $201-$300 | 13 | 13.54% |
| $301-$500 | 1 | 1.04% |
| $501+ | 0 | 0.00% |
| Worldwide FB ads agencies minimum project | ||
| Row Labels | Count of Single project minimum | Worldwide FB ads agencies minimum project |
| Under $1,000 | 18 | 18.75% |
| $1,000-$1,999 | 21 | 21.88% |
| $2,000-$2,999 | 18 | 18.75% |
| $3,000-$3,999 | 8 | 8.33% |
| $4,000-$4,999 | 3 | 3.13% |
| $5,000+ | 22 | 22.92% |
| Do not accept one-time projects | 2 | 2.08% |
| No minimum | 4 | 4.17% |
| Worldwide FB ads agencies monthly minimum retainer | ||
| Row Labels | Count of Monthly minimum budget | Worldwide FB ads agencies monthly minimum retainer |
| Under $1,000 | 24 | 25.00% |
| $1000-1,999 | 18 | 18.75% |
| $2000-2,999 | 20 | 20.83% |
| $3000-3,999 | 13 | 13.54% |
| $4000-4,999 | 4 | 4.17% |
| $5,000+ | 12 | 12.50% |
| No minimum | 5 | 5.21% |
| Size of Company | Under $50 | $51-$100 | $101-$150 | $151-$200 | $201-$300 | $301-$500 | $501+ | Don’t bill hourly | don’t do hourly |
| 1 (solo practice) | 9.62% | 31.73% | 23.08% | 20.19% | 9.62% | 1.92% | 2.88% | 0.96% | 0.00% |
| 11-20 | 10.00% | 0.00% | 45.00% | 30.00% | 15.00% | 0.00% | 0.00% | 0.00% | 0.00% |
| 2-5 | 11.43% | 20.00% | 38.57% | 12.86% | 12.86% | 1.43% | 1.43% | 1.43% | 1.43% |
| 21-50 | 3.57% | 14.29% | 35.71% | 28.57% | 14.29% | 3.57% | 0.00% | 0.00% | 0.00% |
| 5-10 | 8.33% | 8.33% | 29.17% | 29.17% | 12.50% | 8.33% | 0.00% | 4.17% | 4.17% |
| 51+ | 4.00% | 24.00% | 16.00% | 28.00% | 20.00% | 4.00% | 4.00% | 0.00% | 0.00% |
| Grand Total | 8.86% | 21.77% | 29.89% | 21.40% | 12.55% | 2.58% | 1.85% | 1.48% | 0.74% |
| Size of Company | Under $1,000 | $1,000-$1,999 | $2,000-$2,999 | $3,000-$3,999 | $4,000-$4,999 | $5,000+ | Do not accept one-time projects | No minimum |
| 1 (solo practice) | 30.77% | 28.85% | 16.35% | 5.77% | 1.92% | 10.58% | 1.92% | 3.85% |
| 11-20 | 10.00% | 25.00% | 30.00% | 15.00% | 0.00% | 10.00% | 10.00% | 0.00% |
| 2-5 | 32.86% | 27.14% | 14.29% | 1.43% | 2.86% | 11.43% | 5.71% | 4.29% |
| 21-50 | 10.71% | 25.00% | 25.00% | 10.71% | 3.57% | 17.86% | 0.00% | 7.14% |
| 5-10 | 25.00% | 29.17% | 8.33% | 4.17% | 0.00% | 29.17% | 4.17% | 0.00% |
| 51+ | 12.00% | 8.00% | 12.00% | 12.00% | 8.00% | 48.00% | 0.00% | 0.00% |
| Grand Total | 25.46% | 25.83% | 16.61% | 6.27% | 2.58% | 16.61% | 3.32% | 3.32% |
| Size of Company | Under $1,000 | $1,000-$1,999 | $2,000-$2,999 | $3,000-$3,999 | $4,000-$4,999 | $5,000+ | Do not accept one-time projects | No minimum |
| 1 (solo practice) | 29.81% | 29.81% | 16.35% | 6.73% | 0.00% | 7.69% | 0.96% | 8.65% |
| 11-20 | 20.00% | 20.00% | 35.00% | 25.00% | 0.00% | 0.00% | 0.00% | 0.00% |
| 2-5 | 34.29% | 32.86% | 14.29% | 4.29% | 5.71% | 4.29% | 1.43% | 2.86% |
| 21-50 | 14.29% | 21.43% | 21.43% | 25.00% | 0.00% | 7.14% | 0.00% | 10.71% |
| 5-10 | 37.50% | 16.67% | 16.67% | 8.33% | 0.00% | 12.50% | 8.33% | 0.00% |
| 51+ | 12.00% | 8.00% | 12.00% | 12.00% | 12.00% | 40.00% | 0.00% | 4.00% |
| Grand Total | 27.68% | 25.83% | 17.34% | 9.96% | 2.58% | 9.59% | 1.48% | 5.54% |
Tired of not closing enough consulting clients? Download our free guide to closing more of the prospects you pitch.
Oops! We could not locate your form.
We are frequently asked how much marketing agencies and consultants charge. This entire survey was geared towards answering that question, but this question specifically deals with the overall hourly rate pricing of digital marketing agencies and consultants who responded to our survey.
While it is impossible to nail down a specific average hourly rate based on our data, if we try by averaging the hourly rate ranges into the middle number for each, then the average hourly rate for digital marketers and digital marketing firms worldwide is $148.13 per hour.
Tired of not closing enough consulting clients? Download our free guide to closing more of the prospects you pitch.
Oops! We could not locate your form.
Using the same data, the average hourly rate for US digital marketers/firm is $167.28 and the average hourly rate for UK digital marketers/firms is $111.36.
Here is the data:
| Hourly rate | Country |
| $148.13 | All |
| $167.28 | US only |
| $111.36 | UK |
| $130.30 | All other countries |
The synopsis of this section is:
Here is the overview of hourly rate ranges regardless of company size:
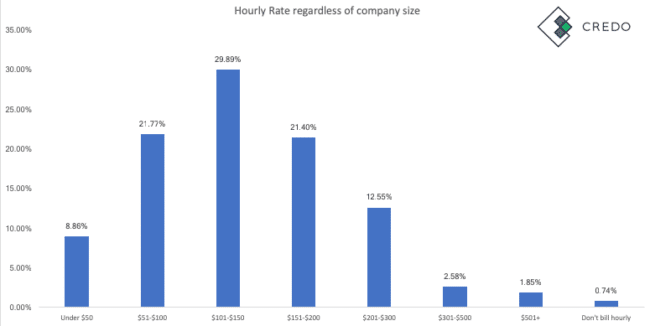
And the raw data:
| Under $50 | $51-$100 | $101-$150 | $151-$200 | $201-$300 | $301-$500 | $501+ | Don’t bill hourly |
| 8.86% | 21.77% | 29.89% | 21.40% | 12.55% | 2.58% | 1.85% | 0.74% |
If we break it down further, you can see the average hourly rate ranges by size of company:
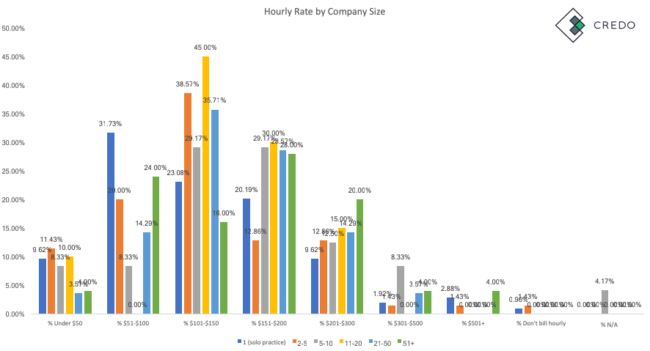
Here is the raw data:
| Company Size | % Under $50 | % $51-$100 | % $101-$150 | % $151-$200 | % $201-$300 | % $301-$500 | % $501+ | % Don’t bill hourly |
| 1 (solo practice) | 9.62% | 31.73% | 23.08% | 20.19% | 9.62% | 1.92% | 2.88% | 0.96% |
| 2-5 | 11.43% | 20.00% | 38.57% | 12.86% | 12.86% | 1.43% | 1.43% | 1.43% |
| 5-10 | 8.33% | 8.33% | 29.17% | 29.17% | 12.50% | 8.33% | 0.00% | 0.00% |
| 11-20 | 10.00% | 0.00% | 45.00% | 30.00% | 15.00% | 0.00% | 0.00% | 0.00% |
| 21-50 | 3.57% | 14.29% | 35.71% | 28.57% | 14.29% | 3.57% | 0.00% | 0.00% |
| 51+ | 4.00% | 24.00% | 16.00% | 28.00% | 20.00% | 4.00% | 4.00% | 0.00% |
Here is the breakdown of agency hourly rates (as a percentage of the total number of respondents in that range):
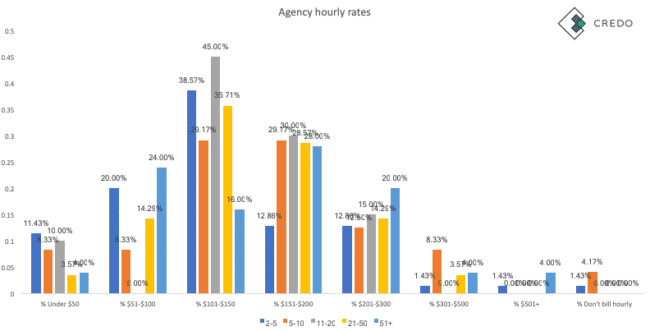
And the raw data:
| Company Size | % Under $50 | % $51-$100 | % $101-$150 | % $151-$200 | % $201-$300 | % $301-$500 | % $501+ | % Don’t bill hourly |
| 2-5 | 11.43% | 20.00% | 38.57% | 12.86% | 12.86% | 1.43% | 1.43% | 1.43% |
| 5-10 | 8.33% | 8.33% | 29.17% | 29.17% | 12.50% | 8.33% | 0.00% | 4.17% |
| 11-20 | 10.00% | 0.00% | 45.00% | 30.00% | 15.00% | 0.00% | 0.00% | 0.00% |
| 21-50 | 3.57% | 14.29% | 35.71% | 28.57% | 14.29% | 3.57% | 0.00% | 0.00% |
| 51+ | 4.00% | 24.00% | 16.00% | 28.00% | 20.00% | 4.00% | 4.00% | 0.00% |
As you can see from the graph, most agencies cluster in the $100-$200 per hour range. Some interesting observations:
The observation from 2017 that smaller agencies are more likely to charge more as are larger agencies still seems to mostly hold true, though this year we see the larger companies charging more than in that survey.
If this is true, it means that agencies are on the whole charging more now than two years ago. This is a good thing if it enables them to do better work!
While this is useful to see, it also made us wonder how this varies by country. So here is average hourly rate by country for agencies:
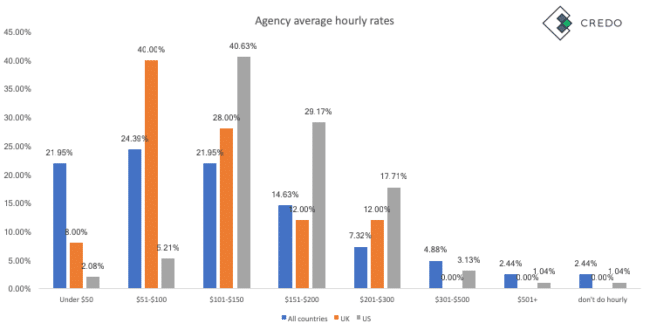
And here’s the data:
| Under $50 | $51-$100 | $101-$150 | $151-$200 | $201-$300 | $301-$500 | $501+ | don’t do hourly | |
| All countries | 21.95% | 24.39% | 21.95% | 14.63% | 7.32% | 4.88% | 2.44% | 2.44% |
| UK | 8.00% | 40.00% | 28.00% | 12.00% | 12.00% | 0.00% | 0.00% | 0.00% |
| US | 2.08% | 5.21% | 40.63% | 29.17% | 17.71% | 3.13% | 1.04% | 1.04% |
The interesting callouts are:
Here are the solo consultant average hourly rates, as a percentage of the whole of consultant responses:

Here’s the raw data:
| Company Size | % Under $50 | % $51-$100 | % $101-$150 | % $151-$200 | % $201-$300 | % $301-$500 | % $501+ | % Don’t bill hourly |
| 1 (solo practice) | 9.62% | 31.73% | 23.08% | 20.19% | 9.62% | 1.92% | 2.88% | 0.96% |
It is very interesting to see that worldwide:
While this is useful to see, it also made us wonder how this varies by country. So here is average hourly rate by country for consultants:
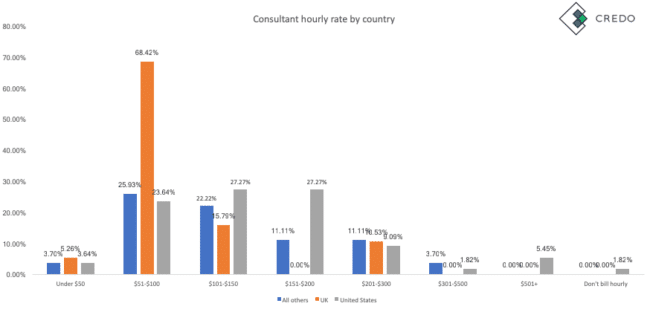
And here is the raw data:
| Under $50 | $51-$100 | $101-$150 | $151-$200 | $201-$300 | $301-$500 | $501+ | Don’t bill hourly | |
| All countries | 3.70% | 25.93% | 22.22% | 11.11% | 11.11% | 3.70% | 0.00% | 0.00% |
| UK | 5.26% | 68.42% | 15.79% | 0.00% | 10.53% | 0.00% | 0.00% | 0.00% |
| United States | 3.64% | 23.64% | 27.27% | 27.27% | 9.09% | 1.82% | 5.45% | 1.82% |
A few specific callouts:
On average, US solo consultants charge a LOT more than UK consultants.
After reviewing the above data, let’s recognize that hourly rates are not a great way to gauge if you should work with someone or not. Here’s why.
If one person tells you that they charge $100 an hour and a project will take 30 hours, the project comes out to $3,000 total.
If another person tells you they charge $300 an hour and the project will take 10 hours based on their experience, then the cost is still $3,000.
Of course, you have to determine if you think the $300/hr person can actually get it done in 10 hours. You should also ask why they said 10 hours and why the other said 30 hours. This is usually because of better processes or more experience doing exactly the work you need, but the questions are still good to ask.
In this case, I would also ask for a flat fee project as opposed to an hourly project. If the project ends up taking the $300/hr person more than 10 hours, then they’ve effectively worked for a lower hourly rate. If you hire the $100/hr person and they take more than 30 hours, the same principle applies.
If you were paying them hourly, then your project could easily go from $3,000 to dramatically more. Not paying by the hour in this case will benefit you, as what you really care about is the value you are getting from the project.
Tired of not closing enough consulting clients? Download our free guide to closing more of the prospects you pitch.
Oops! We could not locate your form.

The common question we get is whether it is cheaper to hire an agency or a consultant, and for a long time the answer has been “it depends”.
This is still true, as it depends on the service you need, the firm’s years of experience and specialty, how full they are with work, and so on.
But in the interest of answering the question “how much do digital marketing consultants charge?”, we took a stab at it with our data from the 2019 digital marketing pricing survey.
The survey had 104 solo consultant respondents worldwide, with 55 in the US and the rest spread around the world.
When we normalize the data using the middle number of each range, we can find the average hourly rates for digital marketing consultants.
The average hourly rate for digital marketing consultants worldwide is $140.29 per hour.
The average hourly rate for US-only digital marketing consultants is $161.57.
As you will see below, the takeaways for this section are:
Tired of not closing enough consulting clients? Download our free guide to closing more of the prospects you pitch.
Oops! We could not locate your form.
Let’s look at the digital marketing consultant hourly rates, shall we?
Here is the breakdown of reported hourly rates worldwide for digital marketing consultants:
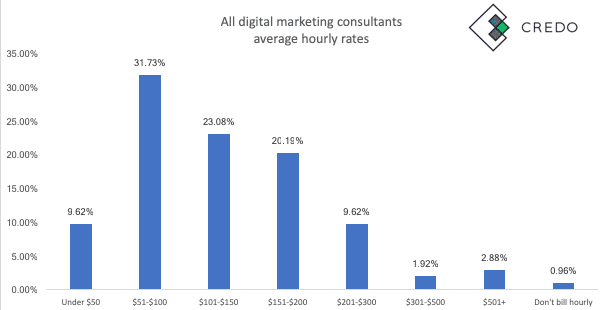
The raw data:
| Hourly Rate | Count | All consultants |
| Under $50 | 10 | 9.62% |
| $51-$100 | 33 | 31.73% |
| $101-$150 | 24 | 23.08% |
| $151-$200 | 21 | 20.19% |
| $201-$300 | 10 | 9.62% |
| $301-$500 | 2 | 1.92% |
| $501+ | 3 | 2.88% |
| Don’t bill hourly | 1 | 0.96% |
Here is the breakdown of reported hourly rates for US-based digital marketing consultants:
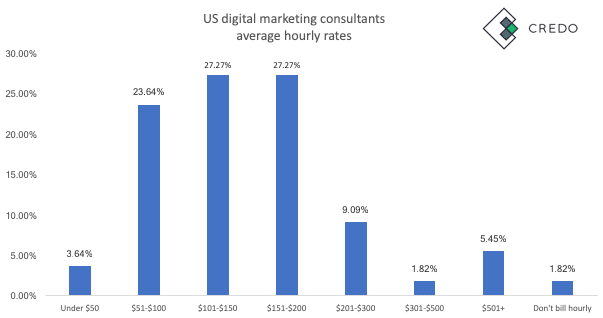
The raw data:
| Hourly Rate | Count | US consultants |
| Under $50 | 2 | 3.64% |
| $51-$100 | 13 | 23.64% |
| $101-$150 | 15 | 27.27% |
| $151-$200 | 15 | 27.27% |
| $201-$300 | 5 | 9.09% |
| $301-$500 | 1 | 1.82% |
| $501+ | 3 | 5.45% |
| Don’t bill hourly | 1 | 1.82% |
Here are the consultant rates (worldwide) by years doing marketing:
| Pricing | Count of Average hourly rate |
| Under $50 | 10 |
| 1-3 | 1 |
| 3-5 | 5 |
| 5-10 | 2 |
| 10+ | 2 |
| $51-$100 | 33 |
| Less than 1 | 1 |
| 1-3 | 2 |
| 3-5 | 2 |
| 5-10 | 16 |
| 10+ | 12 |
| $101-$150 | 24 |
| 1-3 | 1 |
| 5-10 | 10 |
| 10+ | 13 |
| $151-$200 | 21 |
| 3-5 | 2 |
| 5-10 | 4 |
| 10+ | 15 |
| $201-$300 | 10 |
| 3-5 | 1 |
| 5-10 | 2 |
| 10+ | 7 |
| $301-$500 | 2 |
| 10+ | 2 |
| $501+ | 3 |
| 10+ | 3 |
| Don’t bill hourly | 1 |
| 10+ | 1 |
Not surprisingly, the more senior someone gets the more they tend to charge.
Takeaways:
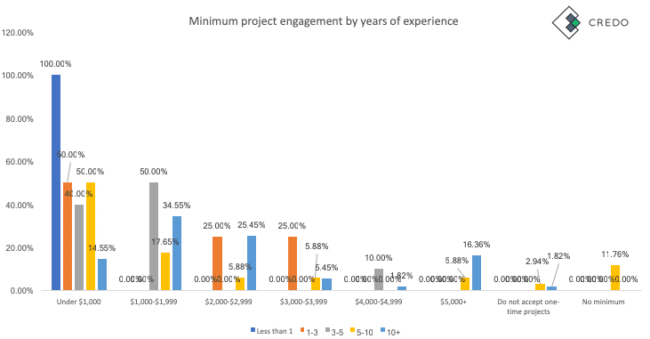
We wanted to have a look at how this visualizes and pricing according to years of experience. Here’s what we came up with:
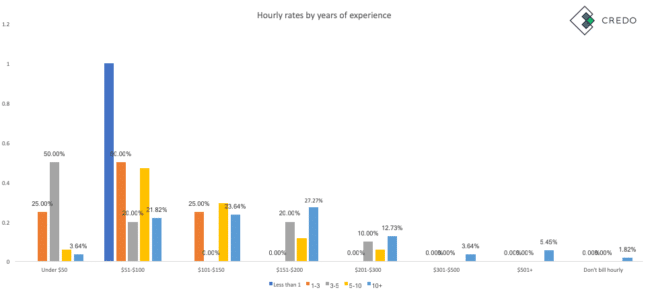
Here is the raw data:
| Hourly rate | Less than 1 | 1-3 | 3-5 | 5-10 | 10+ |
| Under $50 | 0.00% | 25.00% | 50.00% | 5.88% | 3.64% |
| $51-$100 | 100.00% | 50.00% | 20.00% | 47.06% | 21.82% |
| $101-$150 | 0.00% | 25.00% | 0.00% | 29.41% | 23.64% |
| $151-$200 | 0.00% | 0.00% | 20.00% | 11.76% | 27.27% |
| $201-$300 | 0.00% | 0.00% | 10.00% | 5.88% | 12.73% |
| $301-$500 | 0.00% | 0.00% | 0.00% | 0.00% | 3.64% |
| $501+ | 0.00% | 0.00% | 0.00% | 0.00% | 5.45% |
| Don’t bill hourly | 0.00% | 0.00% | 0.00% | 0.00% | 1.82% |
Basically, the spread widens as consultants get more experience.
Now let’s look at digital marketing consultant project minimums.
Overall, here are the percentage of consultants per bucket of project minimums:
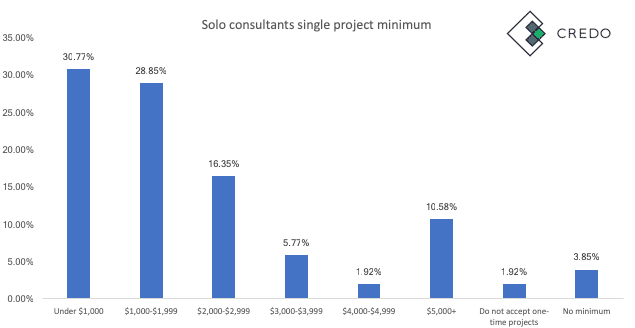
Here is the raw data:
| All consultants single project minimum | ||
| Project minimum | Count of Single project minimum | Percentage |
| Under $1,000 | 32 | 30.77% |
| $1,000-$1,999 | 30 | 28.85% |
| $2,000-$2,999 | 17 | 16.35% |
| $3,000-$3,999 | 6 | 5.77% |
| $4,000-$4,999 | 2 | 1.92% |
| $5,000+ | 11 | 10.58% |
| Do not accept one-time projects | 2 | 1.92% |
| No minimum | 4 | 3.85% |
The interesting callouts are:
Let’s look quickly at how the above numbers break down as we get more granular on years of experience, keeping in mind that as the data gets more granular then the numbers break down a bit and are to be taken with grains of salt.
The raw data:
| Project minimum | Less than 1 | 1-3 | 3-5 | 5-10 | 10+ |
| Under $1,000 | 100.00% | 50.00% | 40.00% | 50.00% | 14.55% |
| $1,000-$1,999 | 0.00% | 0.00% | 50.00% | 17.65% | 34.55% |
| $2,000-$2,999 | 0.00% | 25.00% | 0.00% | 5.88% | 25.45% |
| $3,000-$3,999 | 0.00% | 25.00% | 0.00% | 5.88% | 5.45% |
| $4,000-$4,999 | 0.00% | 0.00% | 10.00% | 0.00% | 1.82% |
| $5,000+ | 0.00% | 0.00% | 0.00% | 5.88% | 16.36% |
| Do not accept one-time projects | 0.00% | 0.00% | 0.00% | 2.94% | 1.82% |
| No minimum | 0.00% | 0.00% | 0.00% | 11.76% | 0.00% |
Here are the counts, which may be more helpful than percentages at this point:
| Row Labels | Less than 1 | 1-3 | 3-5 | 5-10 | 10+ | Grand Total |
| Under $1,000 | 1 | 2 | 4 | 17 | 8 | 32 |
| $1,000-$1,999 | 5 | 6 | 19 | 30 | ||
| $2,000-$2,999 | 1 | 2 | 14 | 17 | ||
| $3,000-$3,999 | 1 | 2 | 3 | 6 | ||
| $4,000-$4,999 | 1 | 1 | 2 | |||
| $5,000+ | 2 | 9 | 11 | |||
| Do not accept one-time projects | 1 | 1 | 2 | |||
| No minimum | 4 | 4 | ||||
| Grand Total | 1 | 4 | 10 | 34 | 55 | 104 |
The interesting points:
Tired of not closing enough consulting clients? Download our free guide to closing more of the prospects you pitch.
Oops! We could not locate your form.
We are asked quite often about SEO pricing, what SEO firms and consultants charge, and how pricing is most often structured.
This page covers the takeaways from our survey as well as how pricing is most often structured.
The SEO pricing overview includes:
Let’s get into the numbers.
Worldwide, SEO firms charge on average $149 per hour.
Here is how it breaks down:
As you can see, on average:
Now let’s look at some deeper cuts to see how the numbers change.
Link building is a common activity in SEO and is absolutely important for ranking sites. We were interested in whether firms that build links charge more or less than firms that do not.
Here are the findings:
Takeaways:
Overall, this data surprises me a little bit, though then I remember that this is worldwide and the data skews lower than I usually think it will.
The figures I expected are that a higher percentage of links-offering firms bill between $101-$200 than non-links firms and that non-links firms charge more as a percentage in the higher hourly rates.
The other way we wanted to look at the data was by company size. Here are the results:
And here’s the data:
| Hourly Rate | Solo | 2 to 5 | 5 to 10 | 10 to 20 | 20 to 50 | 51+ |
| Under $50 | 8.05% | 12.90% | 9.52% | 10.53% | 3.57% | 4.00% |
| $51-$100 | 28.74% | 19.35% | 9.52% | 0.00% | 14.29% | 24.00% |
| $101-$150 | 24.14% | 41.94% | 23.81% | 47.37% | 35.71% | 16.00% |
| $151-$200 | 21.84% | 12.90% | 33.33% | 31.58% | 28.57% | 28.00% |
| $201-$300 | 10.34% | 11.29% | 9.52% | 10.53% | 14.29% | 20.00% |
| $301-$500 | 2.30% | 0.00% | 9.52% | 0.00% | 3.57% | 4.00% |
| $501+ | 3.45% | 1.61% | 0.00% | 0.00% | 0.00% | 4.00% |
| N/A | 1.15% | 4.76% |
Here are the SEO firm minimum monthly one-time projects as reported by our 242 respondents:
The raw data:
| Project minimum | Count of Single project minimum | Worldwide SEO firm single project minimum |
| Under $1,000 | 55 | 22.73% |
| $1,000-$1,999 | 65 | 26.86% |
| $2,000-$2,999 | 45 | 18.60% |
| $3,000-$3,999 | 15 | 6.20% |
| $4,000-$4,999 | 7 | 2.89% |
| $5,000+ | 40 | 16.53% |
| Do not accept one-time projects | 7 | 2.89% |
| No minimum | 8 | 3.31% |
The important takeaways:
Here are the SEO firm minimum monthly retainers worldwide as reported by our 242 respondents:
The raw data:
| Worldwide SEO firm minimum monthly retainer | ||
| Monthly retainer | Count of Monthly minimum budget | Worldwide SEO firm minimum monthly retainer |
| Under $1,000 | 62 | 25.62% |
| $1000-1,999 | 66 | 27.27% |
| $2000-2,999 | 42 | 17.36% |
| $3000-3,999 | 25 | 10.33% |
| $4000-4,999 | 5 | 2.07% |
| $5,000+ | 23 | 9.50% |
| I do not accept ongoing engagements | 4 | 1.65% |
| No minimum | 15 | 6.20% |
Now that we’ve established the worldwide SEO agency/firm rates, let’s look at the US numbers.
Here’s the raw data:
| Hourly Rate | SEO agencies |
| Under $50 | 2.22% |
| $51-$100 | 5.56% |
| $101-$150 | 40.00% |
| $151-$200 | 31.11% |
| $201-$300 | 15.56% |
| $301-$500 | 3.33% |
| $501+ | 1.11% |
The interesting callouts are:
Here are the US SEO firm minimum projects according to our 137 respondents:
The raw data:
| Project minimum | Count of Single project minimum | US SEO firm single project minimum |
| Under $1,000 | 22 | 16.06% |
| $1,000-$1,999 | 37 | 27.01% |
| $2,000-$2,999 | 32 | 23.36% |
| $3,000-$3,999 | 9 | 6.57% |
| $4,000-$4,999 | 3 | 2.19% |
| $5,000+ | 27 | 19.71% |
| Do not accept one-time projects | 3 | 2.19% |
| No minimum | 4 | 2.92% |
Here are the US SEO firm minimum monthly retainers according to our 137 respondents:
The raw data:
| US SEO firm minimum monthly retainer | ||
| Monthly retainer | Count of Monthly minimum budget | US SEO firm minimum monthly retainer |
| Under $1,000 | 25 | 18.25% |
| $1000-1,999 | 41 | 29.93% |
| $2000-2,999 | 28 | 20.44% |
| $3000-3,999 | 17 | 12.41% |
| $4000-4,999 | 4 | 2.92% |
| $5,000+ | 14 | 10.22% |
| I do not accept ongoing engagements | 1 | 0.73% |
| No minimum | 7 | 5.11% |
Now that we’ve covered pricing numbers, let’s talk briefly about how SEO firms and consultants structure their projects.
According to our survey, across 445 respondents, here is how they are willing to bill:
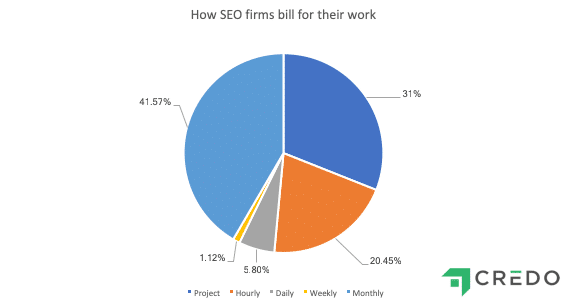
Below are the statistics for how an SEO firm/consultant will bill. Note that each respondent could select multiple, and NBED have multiple ways they might structure a project’s billing:
According to our data:
How do PPC agencies price their work? In our day to day, we speak with a lot of companies looking to hire a firm to help with their PPC campaigns and we get this question:
“Well, how much do PPC firms charge?”
There is a quick answer and a longer answer. You will receive both on this page.
The short answer is this:
Most PPC firms and consultants price their work as a base management fee up to a certain spend, then a percentage of spend. For most, their minimum management fee is $1,500 per month and then 15% of spend above $10,000 in spend. This also varies based on number of channels (and pricing can occur per channel managed).
The longer answer is much more complicated. To help with that, we will lean on the data from the survey.
First let’s look at the average rates of PPC firms worldwide.
Here are the PPC firm worldwide hourly rates, for all company sizes:
The raw data:
| Hourly Rate | Count of Average hourly rate | All firms offering PPC |
| Under $50 | 14 | 9.21% |
| $51-$100 | 36 | 23.68% |
| $101-$150 | 44 | 28.95% |
| $151-$200 | 37 | 24.34% |
| $201-$300 | 17 | 11.18% |
| $301-$500 | 2 | 1.32% |
| $501+ | 1 | 0.66% |
| N/A | 1 | 0.66% |
Here are the project minimums that the PPC firms across the world reported that they take:
The raw data:
| Project minimum | Count of Single project minimum | Percentage of total |
| Under $1,000 | 39 | 25.66% |
| $1,000-$1,999 | 43 | 28.29% |
| $2,000-$2,999 | 24 | 15.79% |
| $3,000-$3,999 | 8 | 5.26% |
| $4,000-$4,999 | 4 | 2.63% |
| $5,000+ | 24 | 15.79% |
| Do not accept one-time projects | 3 | 1.97% |
| No minimum | 7 | 4.61% |
Here are the single project minimums for PPC firms worldwide, based on company size:
That chart is a bit busy, so here is the raw data:
| Project minimum | 1 (solo practice) | 2-5 | 5-10 | 11-20 | 21-50 | 51+ |
| Under $1,000 | 35.00% | 43.24% | 23.08% | 7.14% | 11.54% | 9.09% |
| $1,000-$1,999 | 30.00% | 32.43% | 46.15% | 28.57% | 26.92% | 9.09% |
| $2,000-$2,999 | 15.00% | 5.41% | 15.38% | 28.57% | 26.92% | 13.64% |
| $3,000-$3,999 | 2.50% | 0.00% | 0.00% | 14.29% | 7.69% | 13.64% |
| $4,000-$4,999 | 2.50% | 2.70% | 0.00% | 0.00% | 3.85% | 4.55% |
| $5,000+ | 7.50% | 5.41% | 15.38% | 14.29% | 15.38% | 50.00% |
| Do not accept one-time projects | 0.00% | 5.41% | 0.00% | 7.14% | 0.00% | 0.00% |
| No minimum | 7.50% | 5.41% | 0.00% | 0.00% | 7.69% | 0.00% |
The interesting takeaways in this section are:
Here are the PPC firm worldwide monthly retainer rates as reported by our 152 respondents:
The raw data:
| PPC firm worldwide monthly retainer minimum | ||
| Row Labels | Count of Monthly minimum budget | PPC firm worldwide monthly retainer minimum |
| Under $1,000 | 45 | 29.61% |
| $1000-1,999 | 38 | 25.00% |
| $2000-2,999 | 26 | 17.11% |
| $3000-3,999 | 16 | 10.53% |
| $4000-4,999 | 4 | 2.63% |
| $5,000+ | 12 | 7.89% |
| No minimum | 11 | 7.24% |
Interesting takeaways include:
Here are the average rates for US and UK PPC firms.
The raw data:
| Hourly Rate | Count | PPC firm US |
| Under $50 | 2 | 2.25% |
| $51-$100 | 12 | 13.48% |
| $101-$150 | 31 | 34.83% |
| $151-$200 | 29 | 32.58% |
| $201-$300 | 12 | 13.48% |
| $301-$500 | 2 | 2.25% |
| $501+ | 0 | 0.00% |
Here are the average hourly rates for UK PPC firms:
The raw data:
| Hourly Rate | Count | PPC firm UK |
| Under $50 | 2 | 7.69% |
| $51-$100 | 15 | 57.69% |
| $101-$150 | 5 | 19.23% |
| $151-$200 | 3 | 11.54% |
| $201-$300 | 1 | 3.85% |
| $301-$500 | 0 | 0.00% |
| $501+ | 0 | 0.00% |
UK PPC firms need to charge more!
Now let’s look at average PPC agency rates.
Here are the worldwide PPC agency average hourly rates:
Raw data:
| Hourly Rate | Count | PPC agency hourly |
| Under $50 | 11 | 9.82% |
| $51-$100 | 19 | 16.96% |
| $101-$150 | 38 | 33.93% |
| $151-$200 | 29 | 25.89% |
| $201-$300 | 12 | 10.71% |
| $301-$500 | 1 | 0.89% |
| $501+ | 1 | 0.89% |
Here are the reported project minimums for the PPC agencies in our dataset, of which there are 112:
The raw data:
| Row Labels | Count of Single project minimum | PPC agency worldwide project minimum |
| Under $1,000 | 25 | 22.32% |
| $1,000-$1,999 | 31 | 27.68% |
| $2,000-$2,999 | 18 | 16.07% |
| $3,000-$3,999 | 7 | 6.25% |
| $4,000-$4,999 | 3 | 2.68% |
| $5,000+ | 21 | 18.75% |
| Do not accept one-time projects | 3 | 2.68% |
| No minimum | 4 | 3.57% |
Here are the US PPC agency project minimums from our dataset:
The raw data:
| Row Labels | Count of Single project minimum | PPC agency project minimum |
| Under $1,000 | 12 | 17.39% |
| $1,000-$1,999 | 18 | 26.09% |
| $2,000-$2,999 | 14 | 20.29% |
| $3,000-$3,999 | 4 | 5.80% |
| $4,000-$4,999 | 1 | 1.45% |
| $5,000+ | 15 | 21.74% |
| Do not accept one-time projects | 3 | 4.35% |
| No minimum | 2 | 2.90% |
Interesting takeaways from this section are:
Here are the worldwide PPC agency retainer minimums from our 112 respondents:
The raw data:
| PPC agency worldwide monthly retainer minimum | ||
| Row Labels | Count of Monthly minimum budget | PPC agency worldwide monthly retainer minimum |
| Under $1,000 | 32 | 28.57% |
| $1000-1,999 | 28 | 25.00% |
| $2000-2,999 | 19 | 16.96% |
| $3000-3,999 | 13 | 11.61% |
| $4000-4,999 | 4 | 3.57% |
| $5,000+ | 11 | 9.82% |
| No minimum | 5 | 4.46% |
Here are the US PPC agency monthly retainer minimums as reported by our 69 respondents:
The raw data:
| Retainer minimum | Count of Monthly minimum budget | US PPC agency monthly retainer minimum |
| Under $1,000 | 15 | 21.74% |
| $1000-1,999 | 18 | 26.09% |
| $2000-2,999 | 13 | 18.84% |
| $3000-3,999 | 9 | 13.04% |
| $4000-4,999 | 3 | 4.35% |
| $5,000+ | 9 | 13.04% |
| No minimum | 2 | 2.90% |
Interesting takeaways include:
US PPC agencies are, from our data, more expensive than the worldwide averages.
Now let’s look at PPC consultant rates worldwide and US specific.
Here are the PPC consultant worldwide hourly rates from our dataset containing 40 PPC consultants:
The raw data:
| Hourly Rate | Count | PPC consultant hourly rates |
| Under $50 | 3 | 7.50% |
| $51-$100 | 17 | 42.50% |
| $101-$150 | 6 | 15.00% |
| $151-$200 | 8 | 20.00% |
| $201-$300 | 5 | 12.50% |
| $301-$500 | 1 | 2.50% |
| $501+ | 0 | 0.00% |
Here are the PPC consultant worldwide project minimums, of which there were 40 respondents:
The raw data:
| PPC consultant worldwide single project minimum | ||
| Row Labels | Count of Single project minimum | PPC consultant worldwide |
| Under $1,000 | 14 | 35.00% |
| $1,000-$1,999 | 12 | 30.00% |
| $2,000-$2,999 | 6 | 15.00% |
| $3,000-$3,999 | 1 | 2.50% |
| $4,000-$4,999 | 1 | 2.50% |
| $5,000+ | 3 | 7.50% |
| No minimum | 3 | 7.50% |
Here are the US PPC consultant projects minimums from our dataset, in which there were 20 respondents. Thus, we are showing the raw numbers here instead of percentages:
The raw data:
| US PPC consultant project minimums | |
| Single project minimum | Count |
| Under $1,000 | 4 |
| $1,000-$1,999 | 7 |
| $2,000-$2,999 | 4 |
| $3,000-$3,999 | 1 |
| $4,000-$4,999 | 1 |
| $5,000+ | 1 |
| No minimum | 2 |
Here are the PPC consultant worldwide monthly retainer minimums from the 40 respondents in our dataset:
The raw data:
| PPC consultant worldwide monthly minimum | ||
| Monthly retainer minimum | Count of Monthly minimum budget | PPC consultant worldwide monthly minimum |
| Under $1,000 | 13 | 32.50% |
| $1000-1,999 | 10 | 25.00% |
| $2000-2,999 | 7 | 17.50% |
| $3000-3,999 | 3 | 7.50% |
| $5,000+ | 1 | 2.50% |
| No minimum | 6 | 15.00% |
We also ran the numbers on how PPC firms charge for their work.
Here is a visualization:
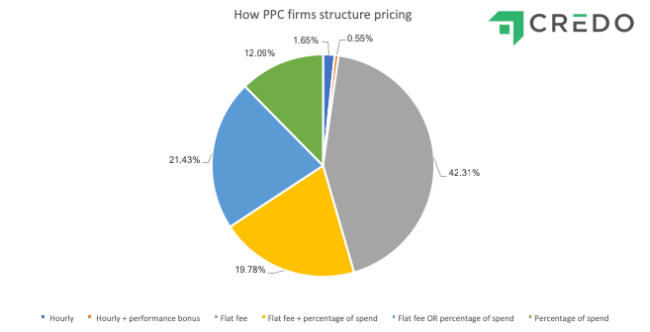
Here are the raw data numbers:
The 2019 version of the digital marketing industry pricing survey was doozy. With 271 respondents across the world, both agencies and consultants, working across a multitude of services there was a LOT of data to analyze and synthesize.
We highly recommend reading through all of the individual chapters of this guide, but if you are looking for the tl;DR version with just the insights then you have come to the right place with this page.
This page is broken into insights for each of the major sections of the guide.
Here are the main takeaways from the digital marketing agency section:
Tired of not closing enough consulting clients? Download our free guide to closing more of the prospects you pitch.
Oops! We could not locate your form.
Here are the main takeaways from the digital marketing agency section:
Here are the main takeaways from the SEO providers section:
Here are the main takeaways from the PPC providers section:
Here are the main takeaways from the Facebook advertising providers section:
Tired of not closing enough consulting clients? Download our free guide to closing more of the prospects you pitch.
Oops! We could not locate your form.
This page last updated on November 4, 2021 by John Doherty
Drive results for your marketing needs with the Credo network. Get started today (it's free and there is no obligation)!
 Loading...